Cosmos
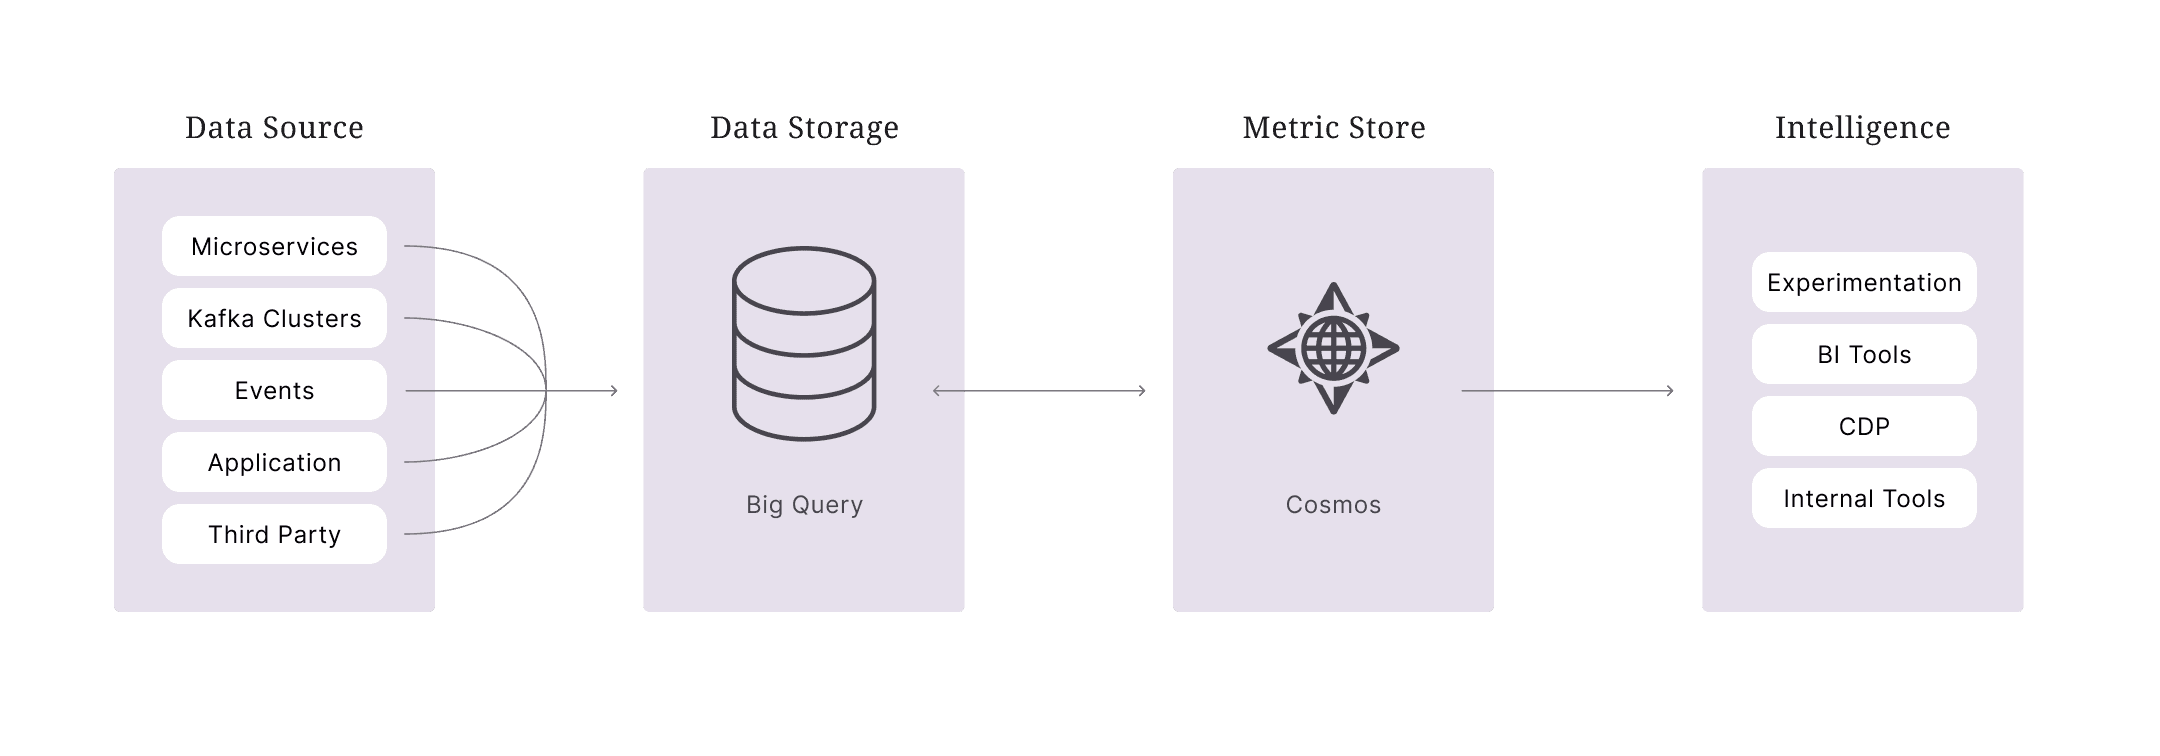
Cosmos is a platform designed for Gojek to allow users to define, compute, explore and analyse quantified measures. Metrics and KPI’s are foundations for an OKR driven company. The ideology behind Cosmos is that you can’t make an organisation data-driven if people building experiences are not able to get their hands on information easily.

Background
This project was nothing more than a question in the beginning. A question to the system and the way everyone in that system works. It was curiosity that gave birth to this project and the question was regarding the way we approached metrics management at Gojek.
This case study is about how we looked at existing methods of data analytics and metrics management to come up with something to make the life of many people at Gojek easy.
Role
Design Lead
Organisation
Gojek
Date
July 2020 - Present
Responsibilities
Strategy, Research, Design, Testing
Discovery
Before we can jump to anything else let’s try to understand the existing system, our users, their pain points and requirements.
“Metrics are not just any data points, they are foundation of a data-driven company.”
If metrics are influencing your decision then it became very important for you to trust that data. To answer if someone can trust this data, we need answers to - Who build it? Is it updated? Is there a process of validation?
If you can’t get answer to these questions then no matter how sophisticated your analysis tools, dashboards or reports are, you won’t be able to build trust in those data points.
Users
On a high-level, there are two distinct sets of users who interact with metric flow. After having multiple conversation with each group we were able to craft major needs and pain points from them.
Business Analysts
Business analysts are a group of individuals who are responsible for the metric definition, computation, and accuracy. They are domain-level experts who create and maintain the metric and are the point of contact for all things related to a metric.
Needs
- Responsibility to create metric definition & its computation.
- Create dashboards and reports for product teams.
- Provide stories with narrative analysis.
- Help product & business teams with metric related questions to provide recommendations for growth.
- Responsible to create tables & working on raw data.
Pain Points
- Exhausting process of managing metrics on a google sheet.
- Managing hundreds of dashboards and educating people about their existence.
- Handling all the burden of analysis requests from business and product.
- Nonstop back and forth communication on analysis reports.
Users Journey
The overall experience of business analysts can broadly be represented with the following three stages.
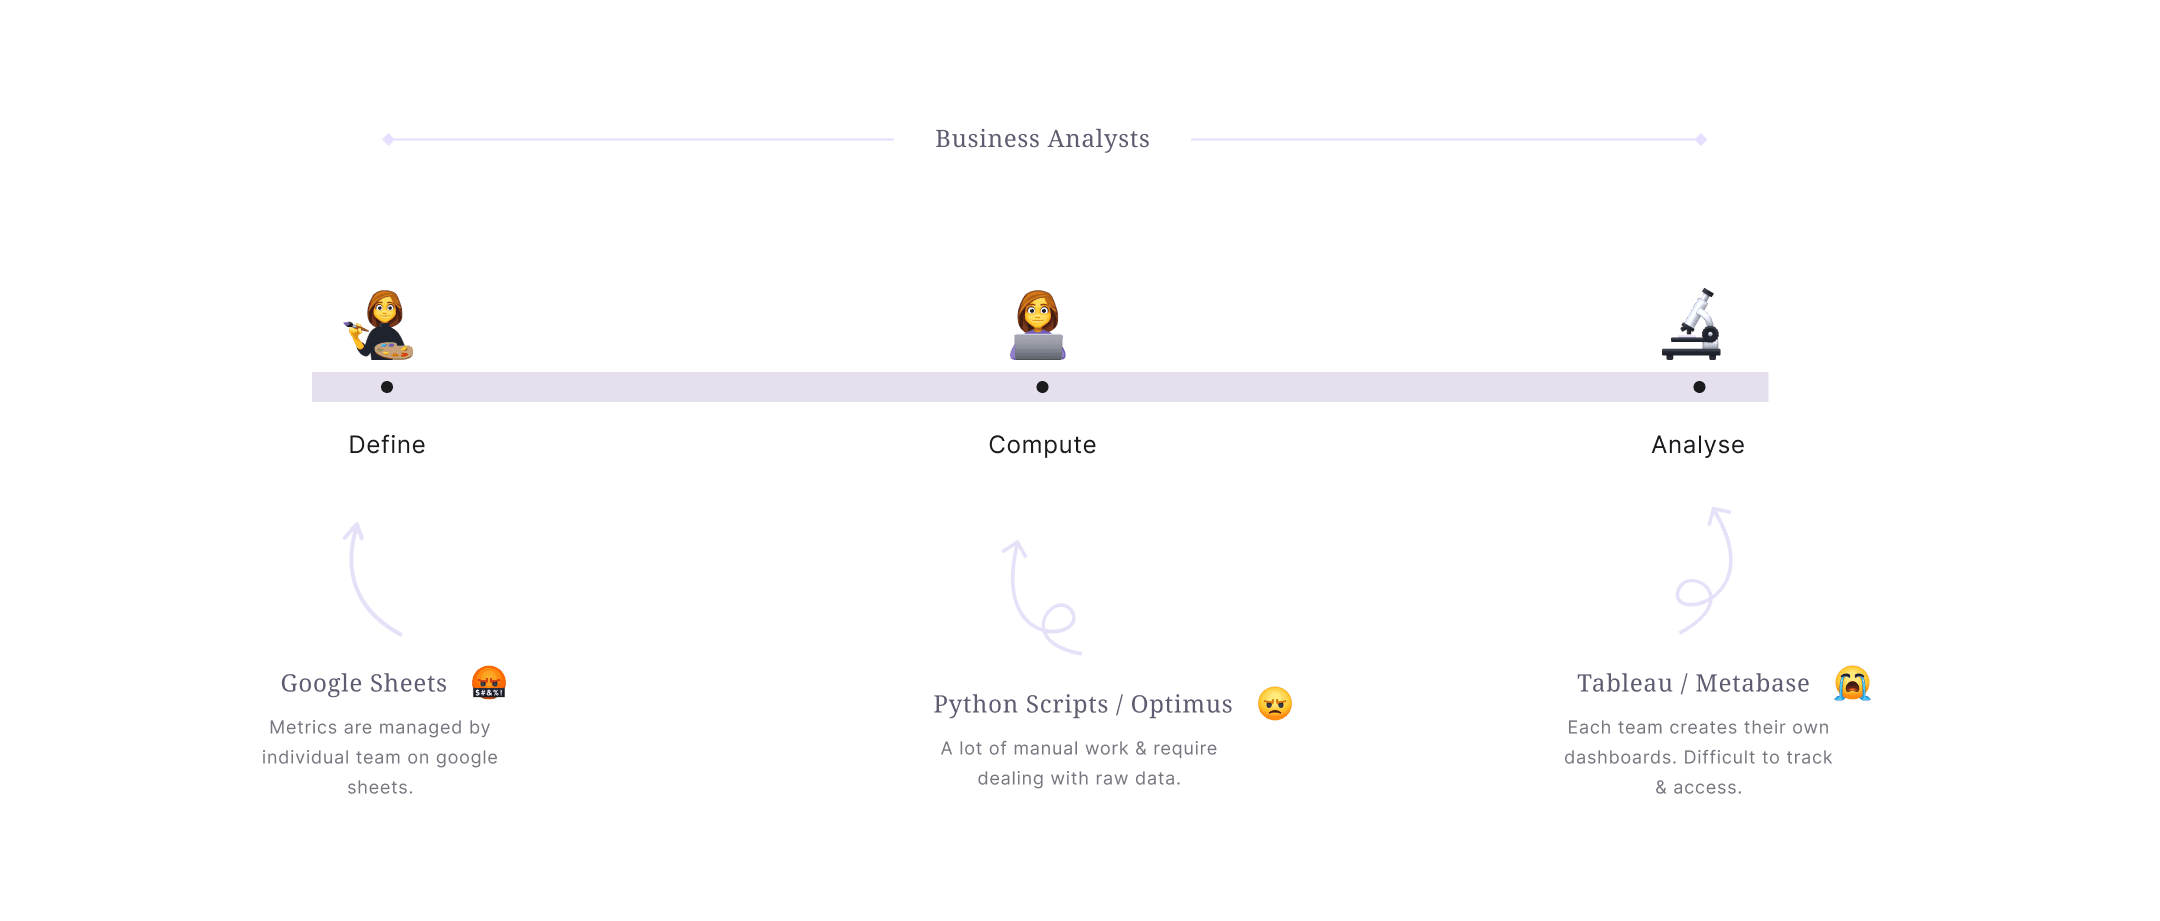
Define the metric definition and formula to keep it a single source of truth. This stage also captures the owners, data source, and other metadata of the metric as well.
Compute the metric using data processing tools. Computation requires analysts to write queries or formulas to calculate the metric in a standard way.
Analyze the metric by setting up intelligence on the metric using data tools. Some of the areas of intelligence can be reporting, anomaly, forecasting, and alerting.
Business Owners
A group of individuals who want to stay up-to-date about the metrics and their behaviour: this group can be a superset of different roles within the organization like product teams, executives, corporate strategy, finance, etc. This group’s needs from the metric workflow can vary based on the use case, e.g., to just be informed about a metric, get alerted on any anomaly on a critical metric, analyze results of different experiments, etc.
Needs
- Visibility on all the available metrics.
- Understanding the reasons behind metrics behaviour to replicate the success and to avoid failures.
- Mapping initiatives with outcomes to show the impact of those initiatives.
- Analysing different data points to make informed decisions.
Pain Points
- Lack of trust and visibility on available metrics.
- Dependency on analysts for understanding metrics and their meta-data.
- Lack of certainty on what drove business performance.
- Dependency on data analysts to get answers to questions like ‘How this metric is performing for x user segment?’
- Time to insights is a drag in making data decisions.
Users Journey
The overall experience of business owners can broadly be represented with the following three stages.
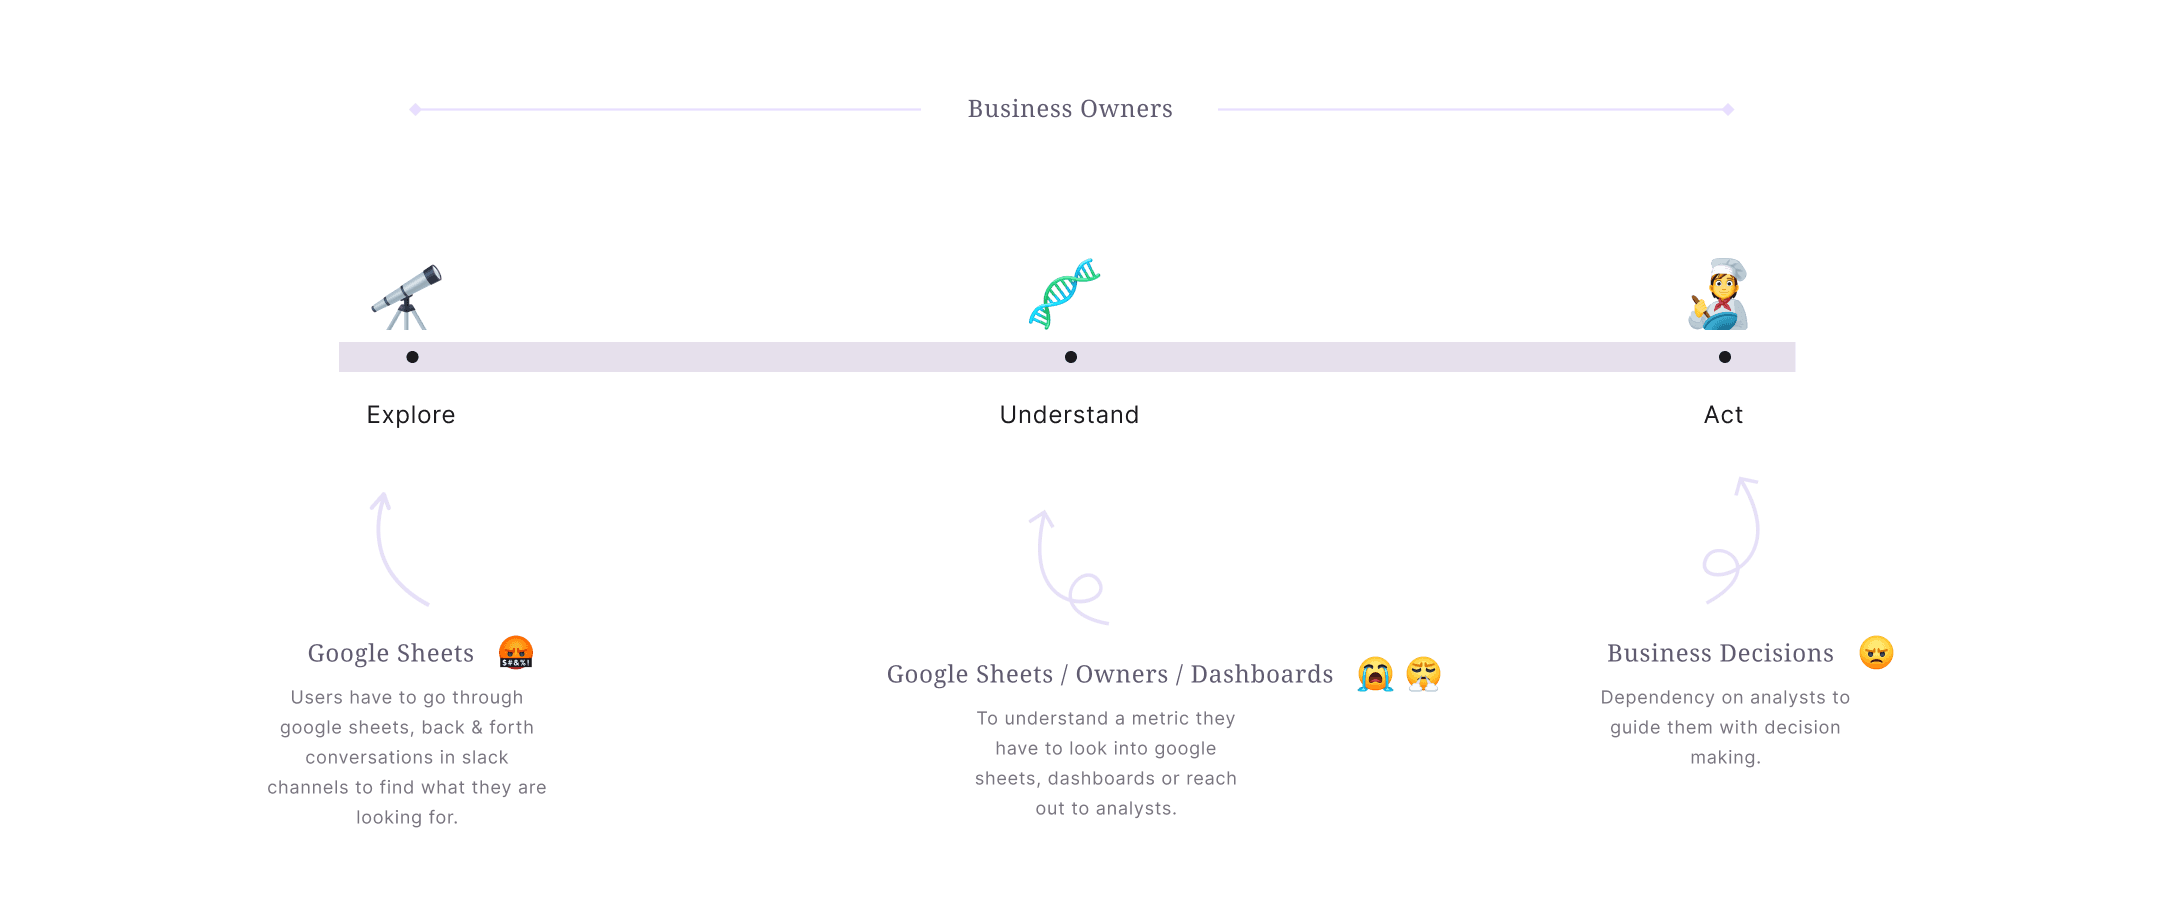
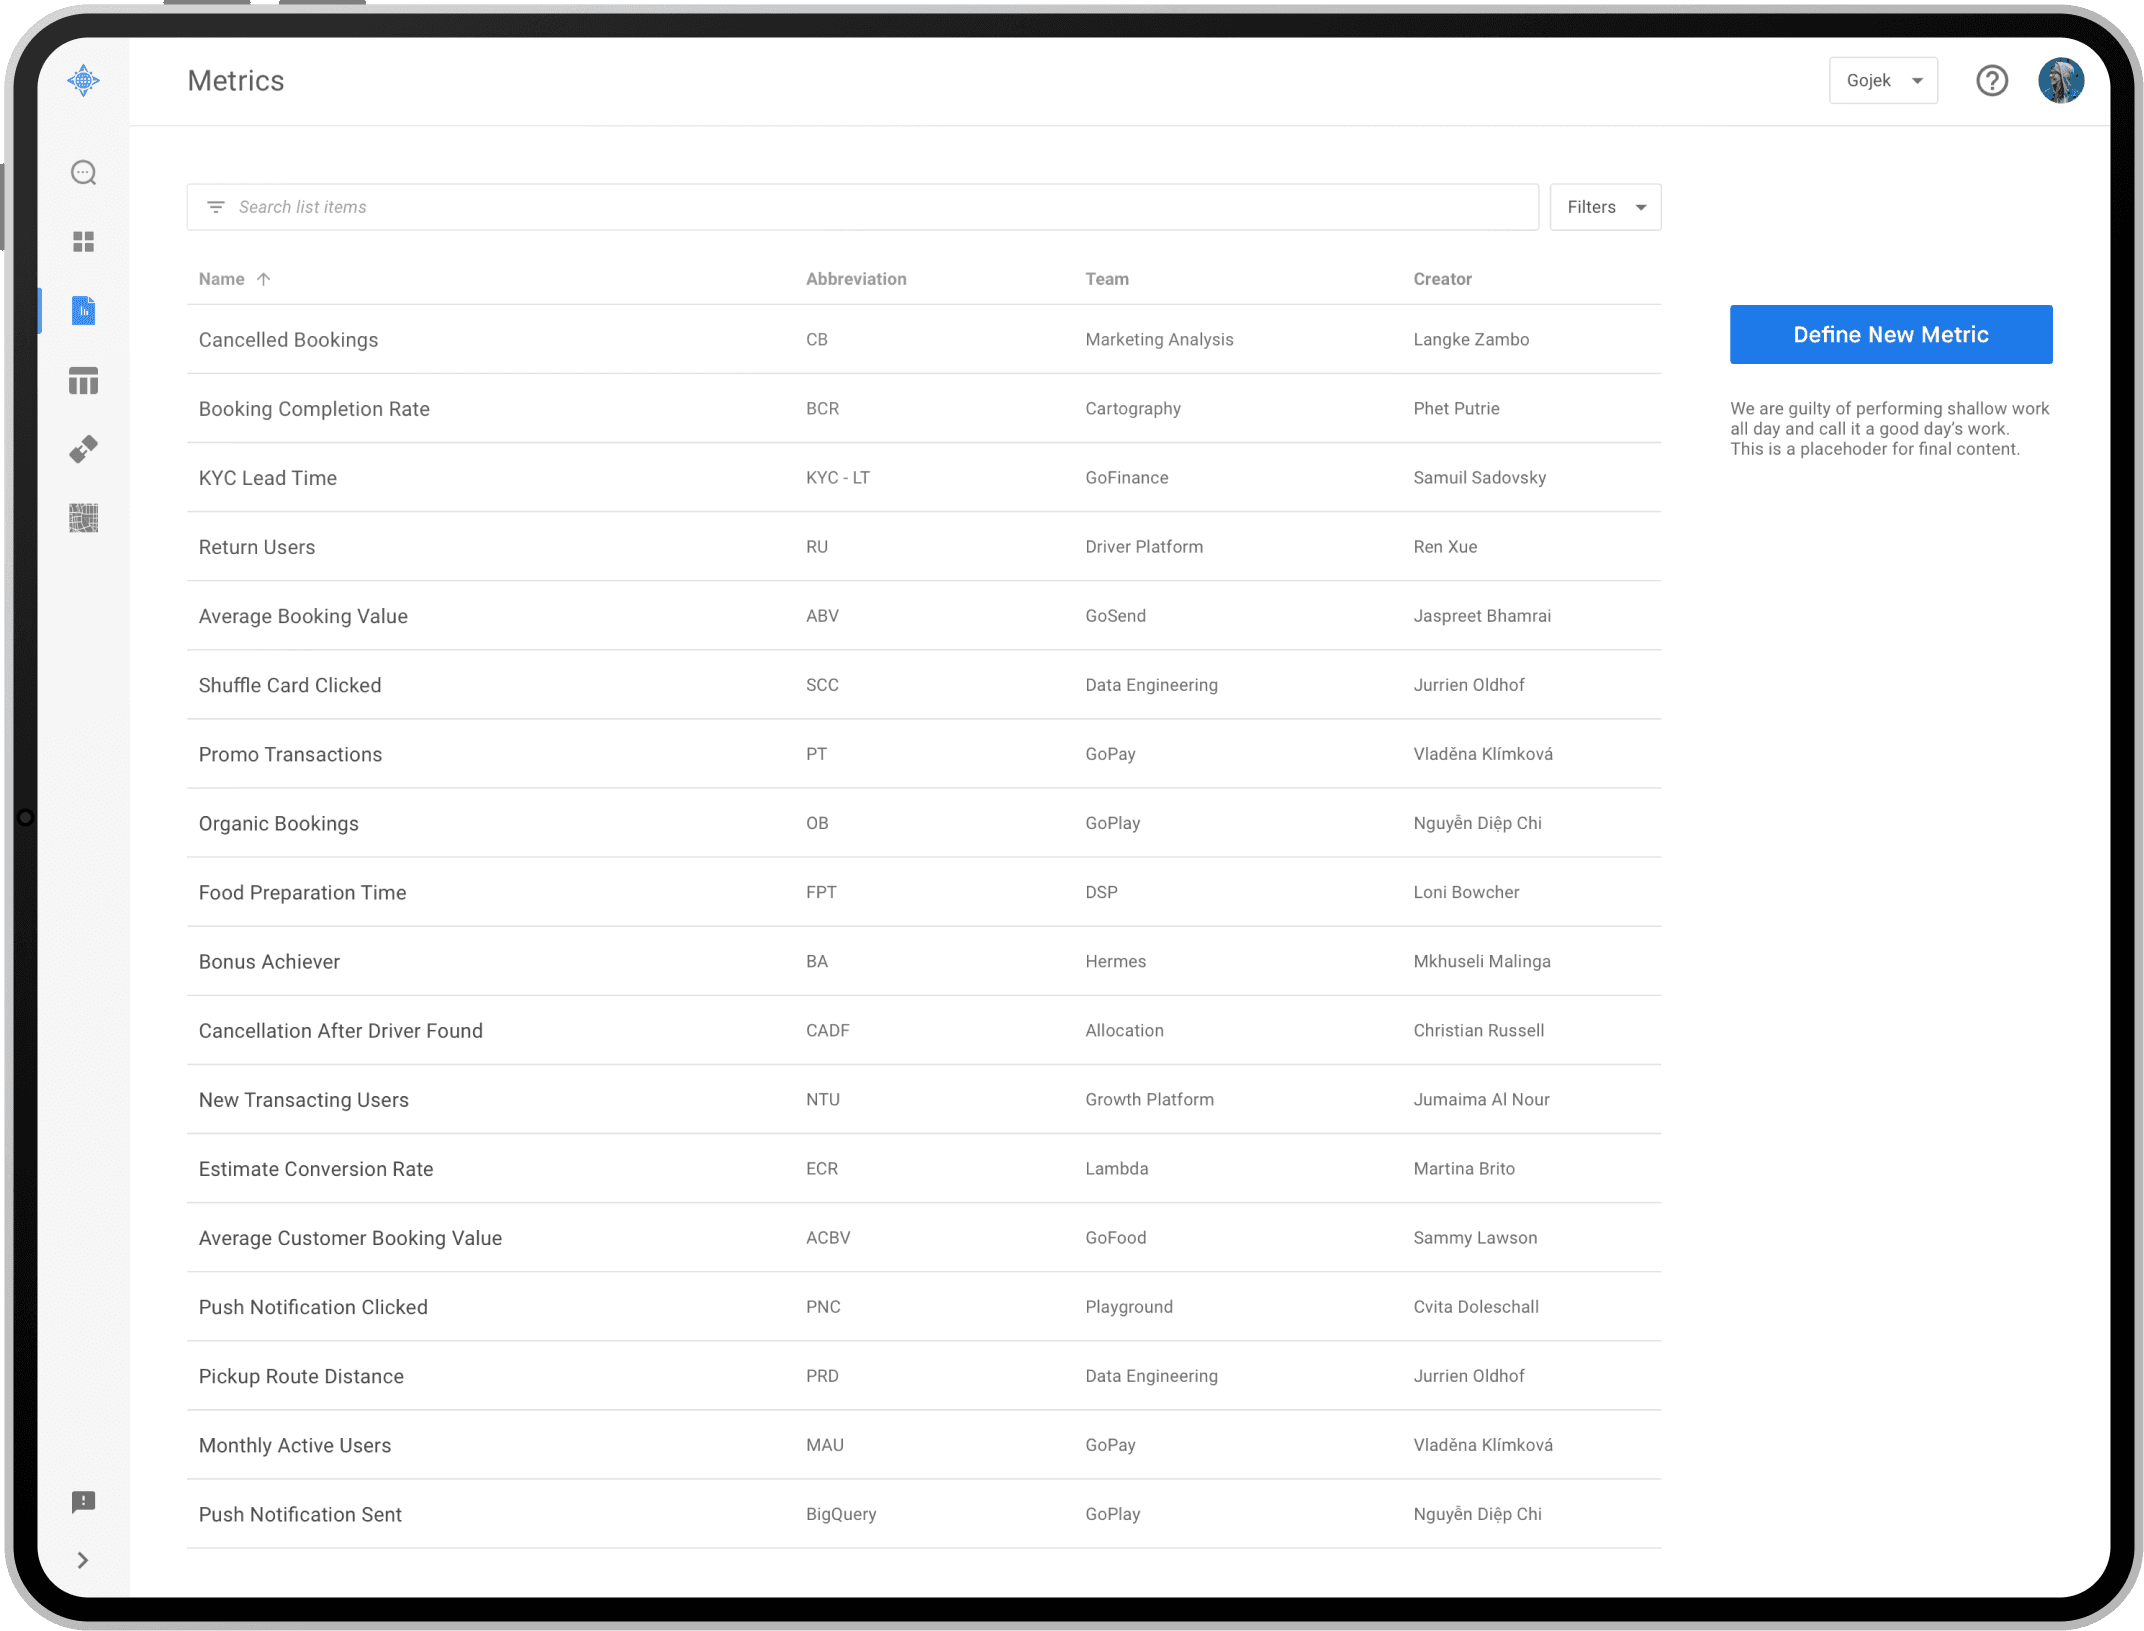
Explore all the available metrics in the organization to know what metrics exist and which ones matter the most. It also allows users to browse through all defined metrics across the organization quickly.
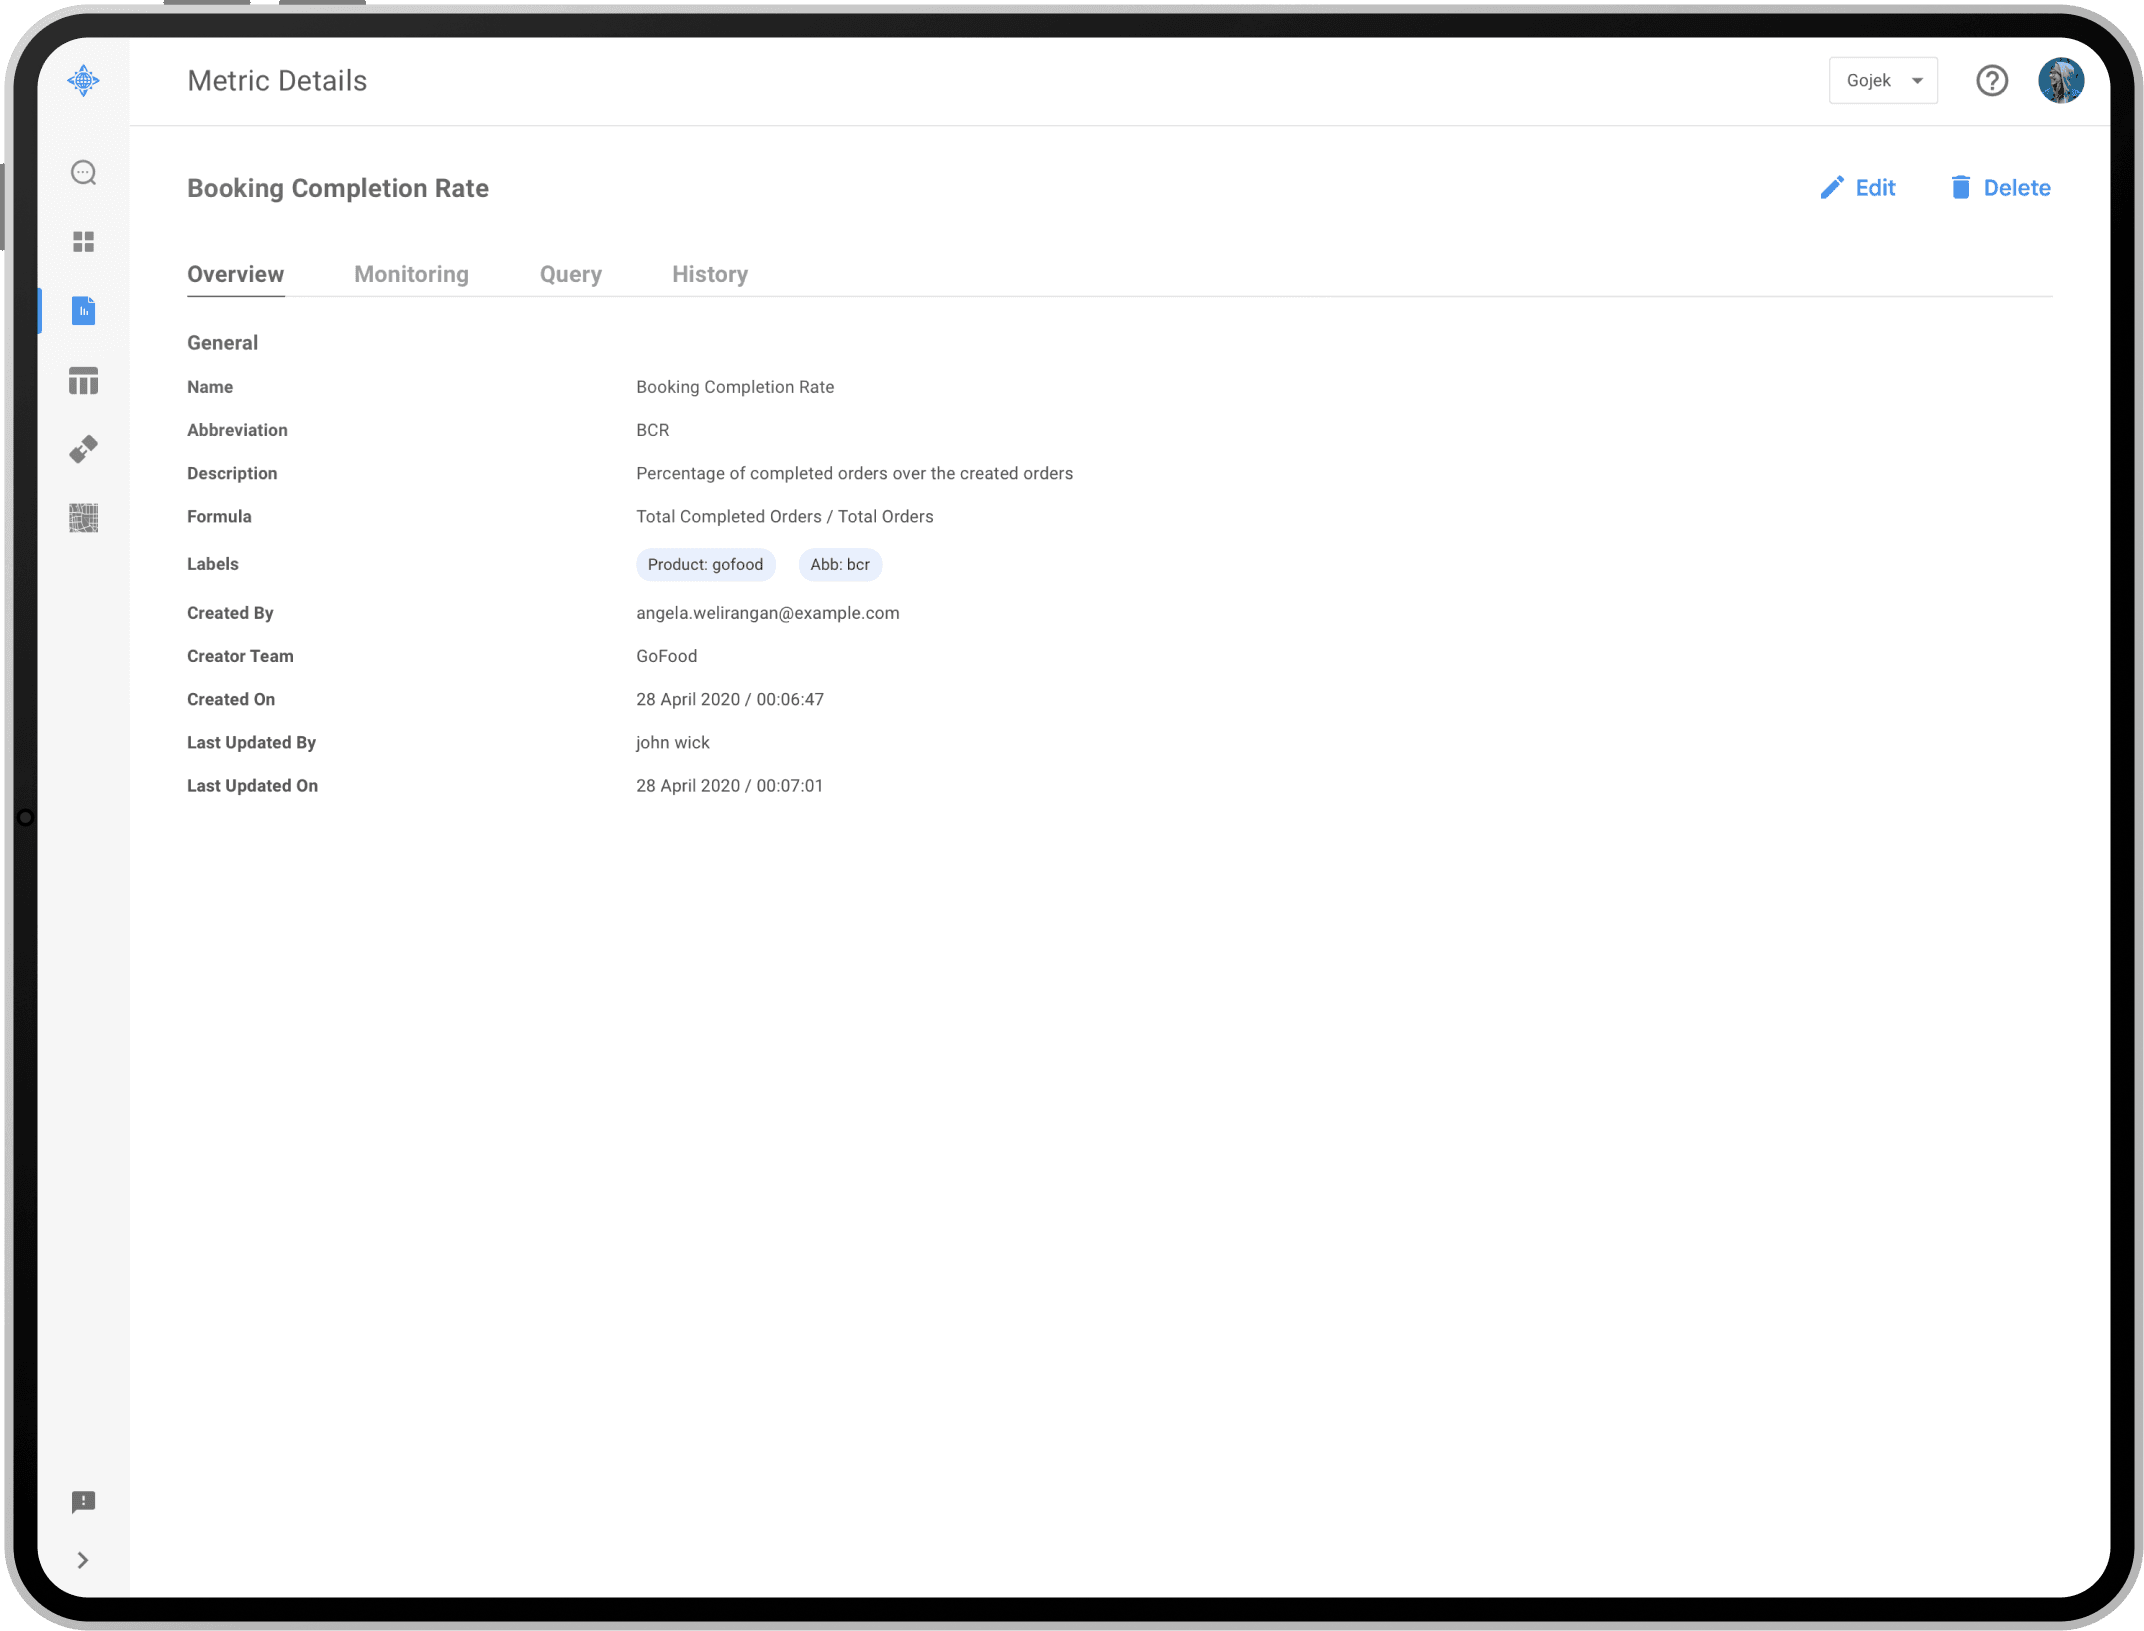
Understand how the metric is defined. It also allows users to view metric details like formula, description, primary owner, and more.
Act on the metric insights to make data-driven business decisions. It empowers different methods to act on the metric.
Existing Landscape
Before we start discussing the proposed solution let’s look into the existing toolset people are using to get things done.
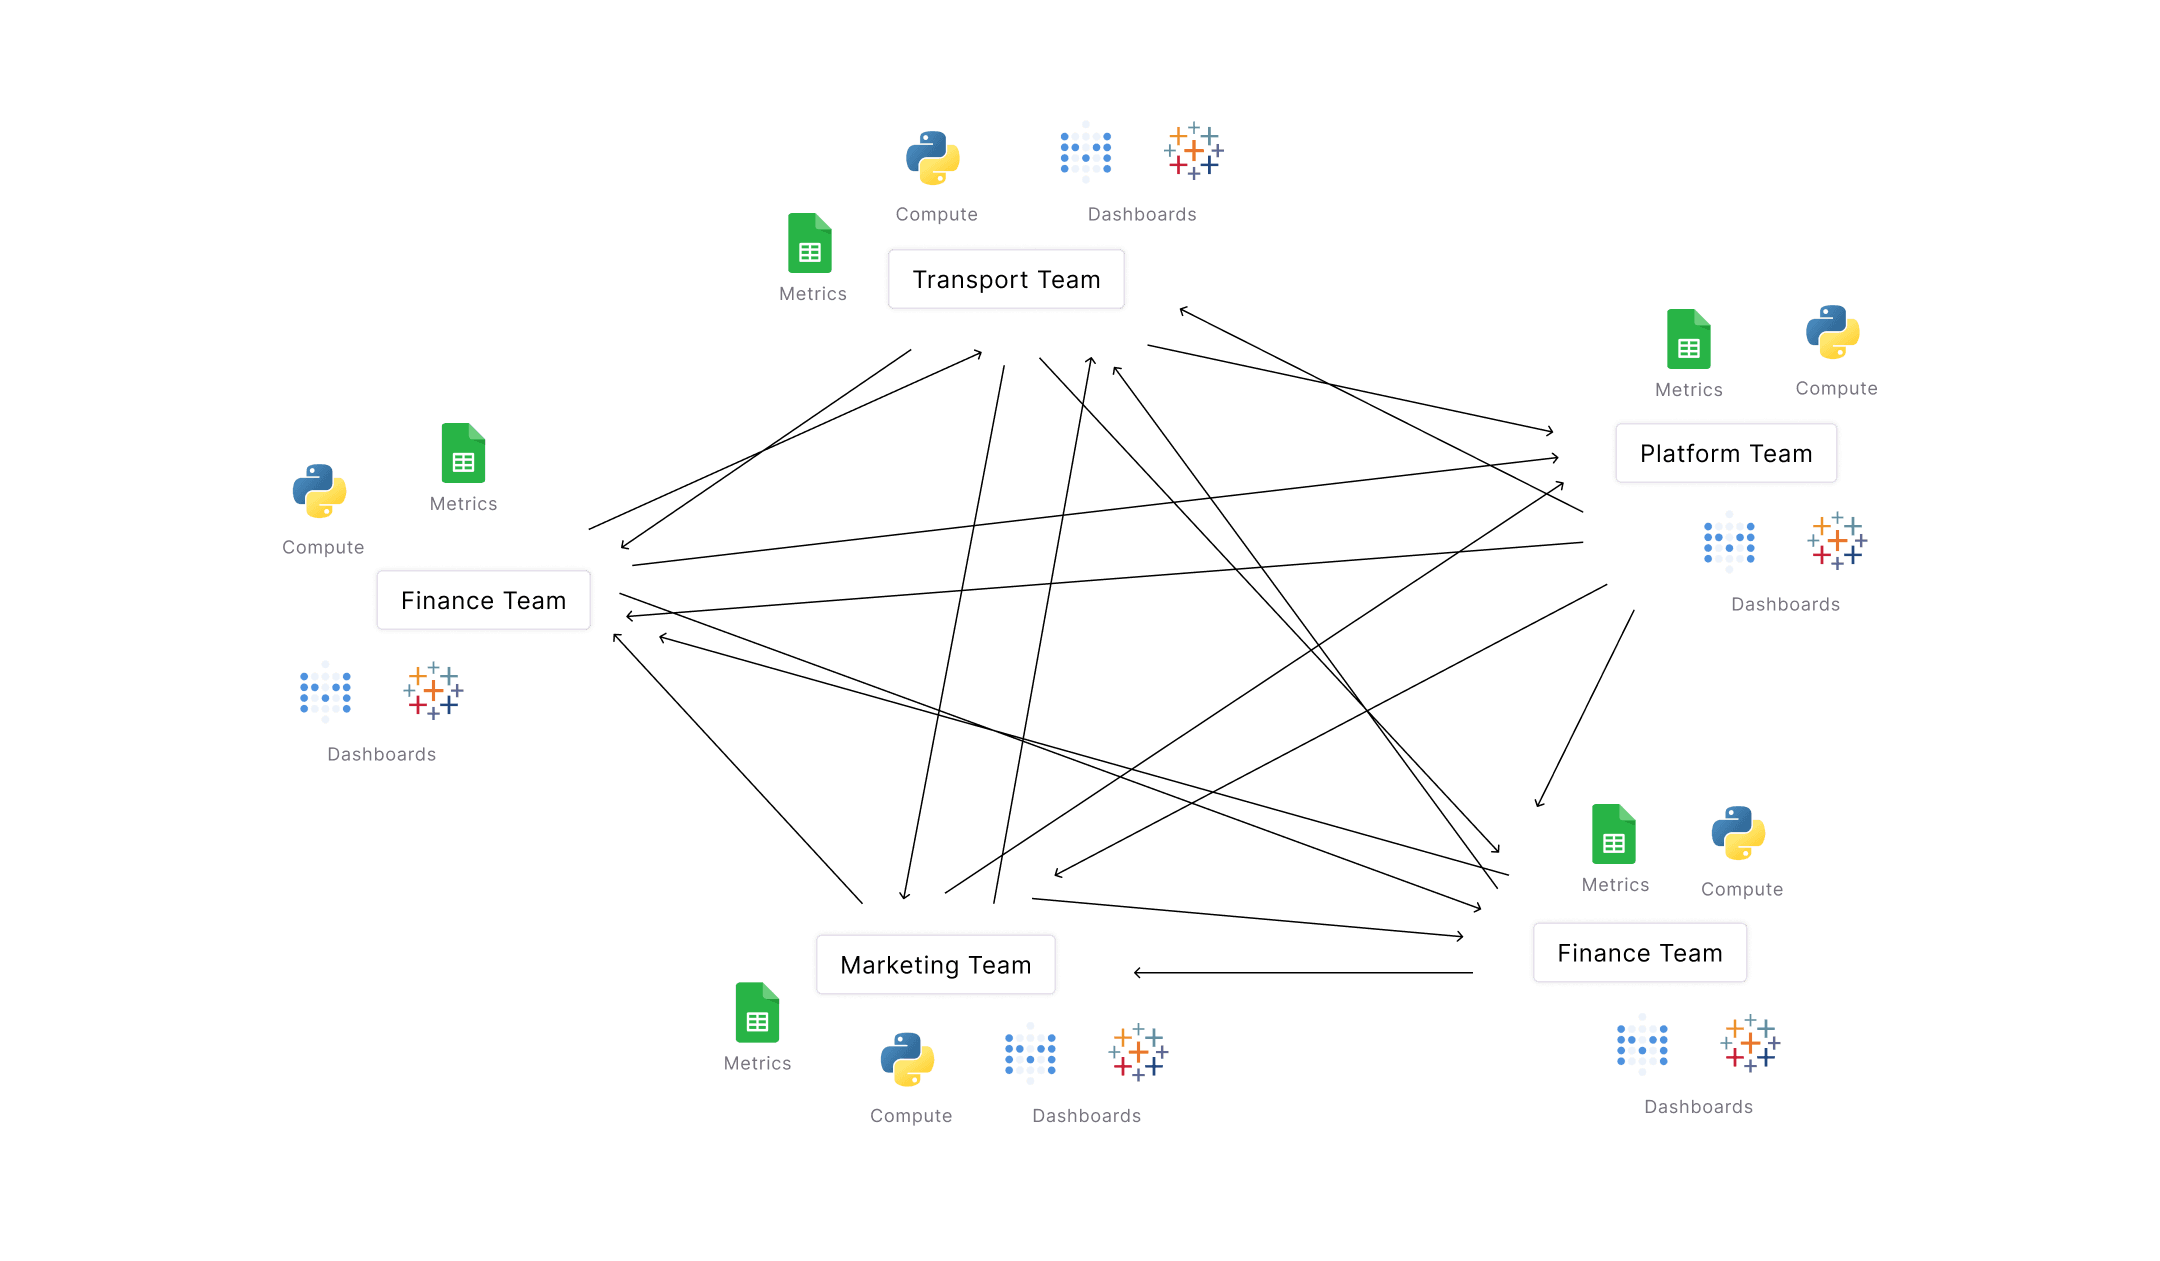
This is what the existing system looks like, each team manages their metrics independently on google sheets and those are being shared across each other.
Metric definition and computational formulas are mentioned in these sheets along with other metadata information. Python scripts and Optimus are used for the computational purpose.
For monitoring and visualisation, separate dashboards are created by each team using Tableau and Metabase.
This was way more chaotic than it looks in the above visualisation. Here are a few of the challenges this system was causing -
- Finding a metric & understanding it was a real pain.
- Difficult to keep track of dashboards and which one is true.
- Dependency on analysts to move ahead.
- It’s hard to know what’s updated and what’s not
- Difficult to track who made the changes and why
- It’s hard to say if a metric is reliable or not
- Difficult to track duplication
Proposed Landscape
We proposed a system design to solve all the existing challenges of metric management. It was thought in a way to be easily scaled and integrated with intelligence-related use cases.
Vision - defining the road ahead
These goals highlight the characteristics of a scalable metric system
- Centralised - A single source of truth for all metrics
- Reliable - Reliable metrics that everyone can agree on.
- Accessible - A single source for all your KPIs —when and where you need it most.
- Actionable - Find answers to drive decisions

Making it centralized
Historically, metrics and KPIs are managed locally, within individual groups, with little coordination. This has to be centralized so that everyone has a similar and monitored way of defining a metric and it’s accessible anywhere data is consumed.
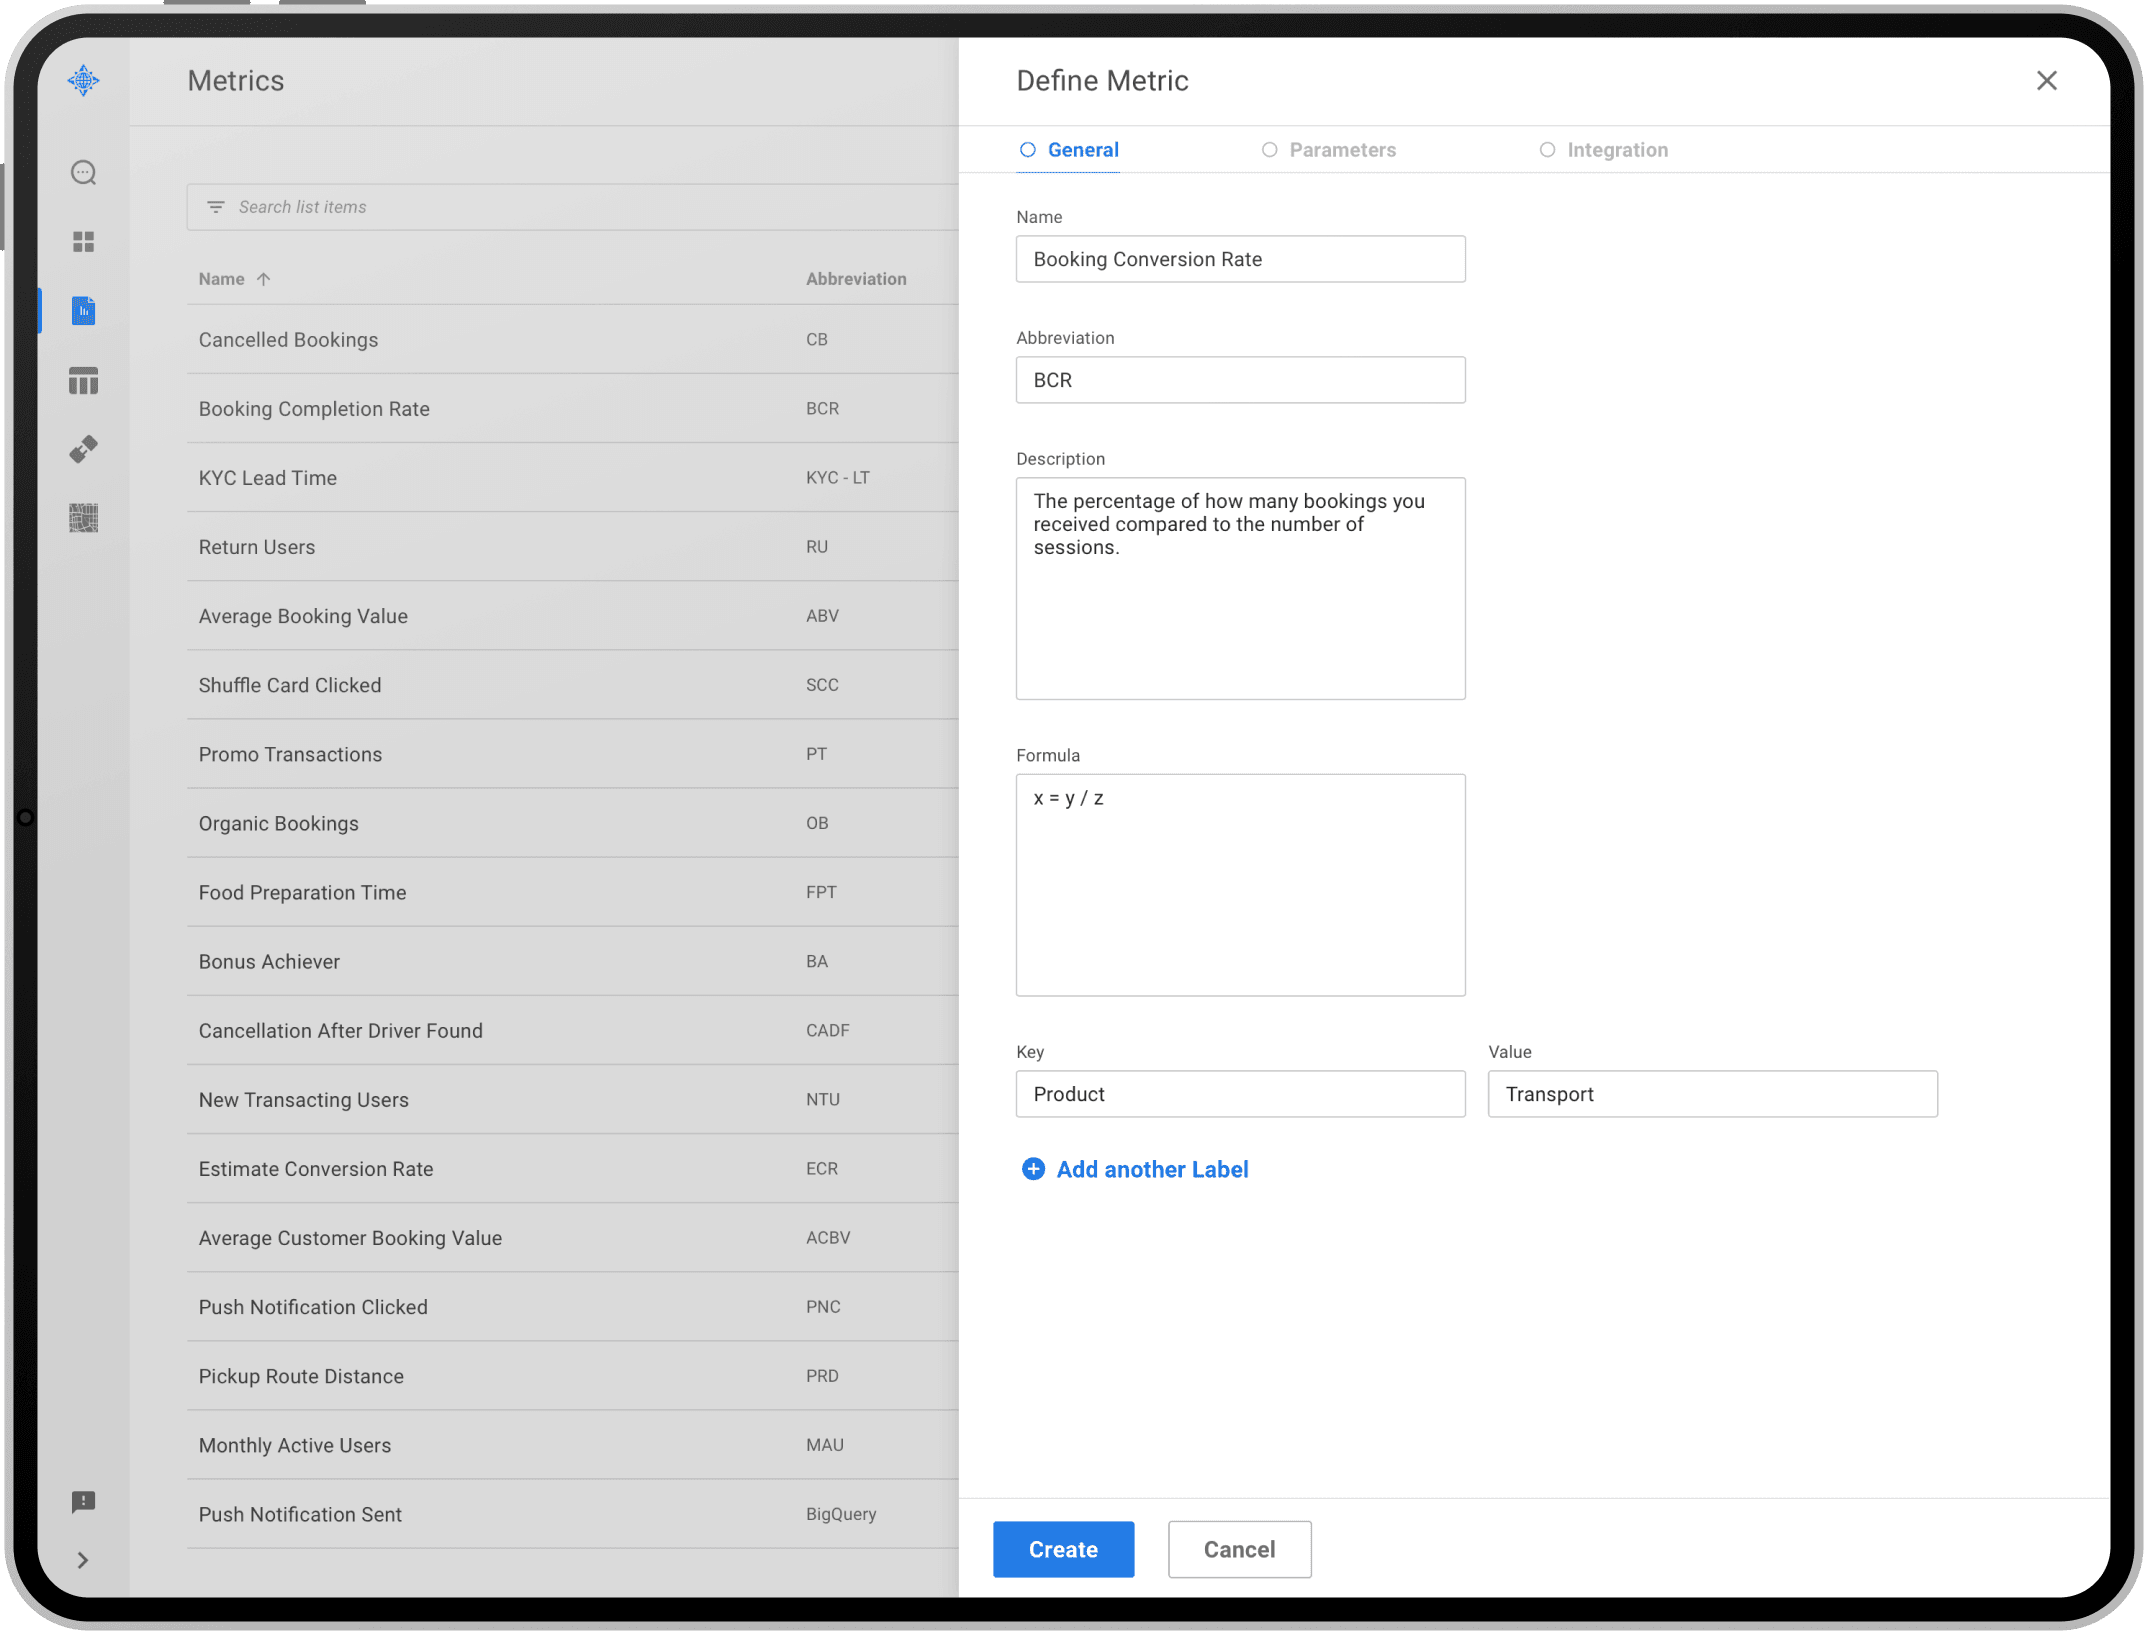
Defining a metric
With a central system, the experience of defining metrics became cohesive, efficient and easy to monitor. This approach helped owners to collaborate in a better way and remove the chances of duplication.
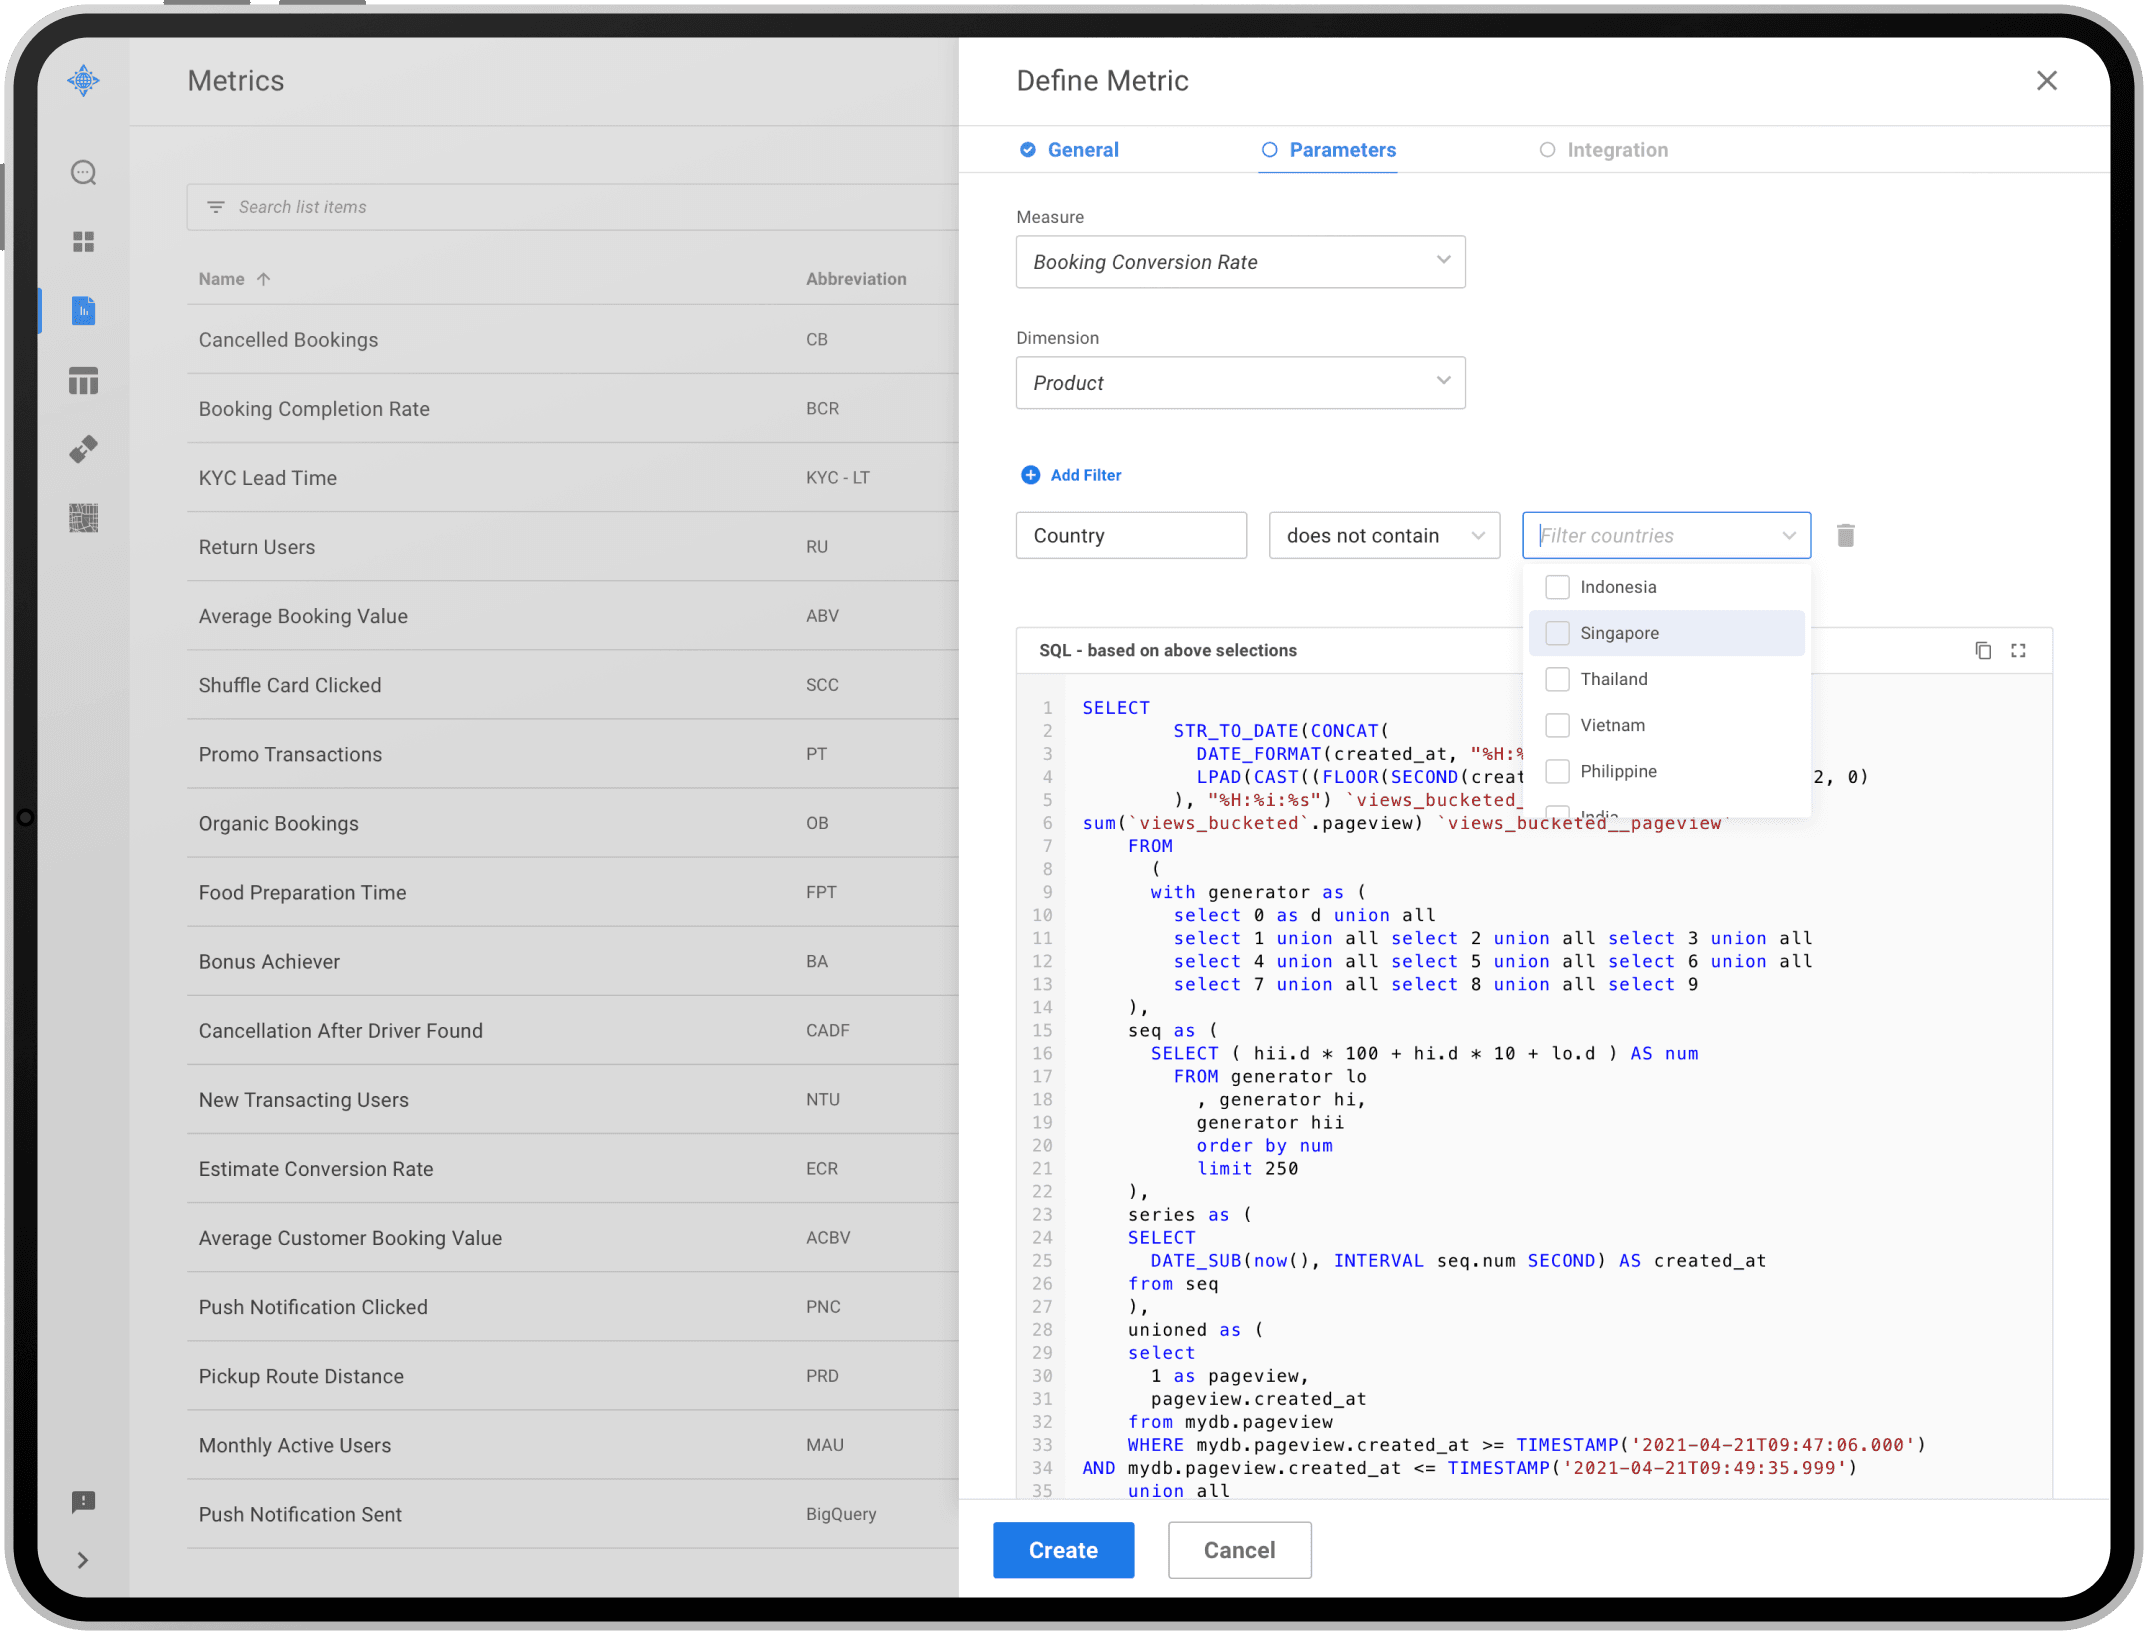
Also, we provided a simple way of defining required conditions through the interface and based on that system generates the SQL Query. This saved a lot of time for data analysts because they used to write this query from scratch.

Making it reliable
The most frequent and frustrating question is - ‘Can I trust this data?’ and as discussed before, to build that trust in our data, users need answers to - Who build it? When was it updated? Is there any approval process?
Users goal is to make decisions based on analysis, not to verify the data itself.
Defining metric formulas
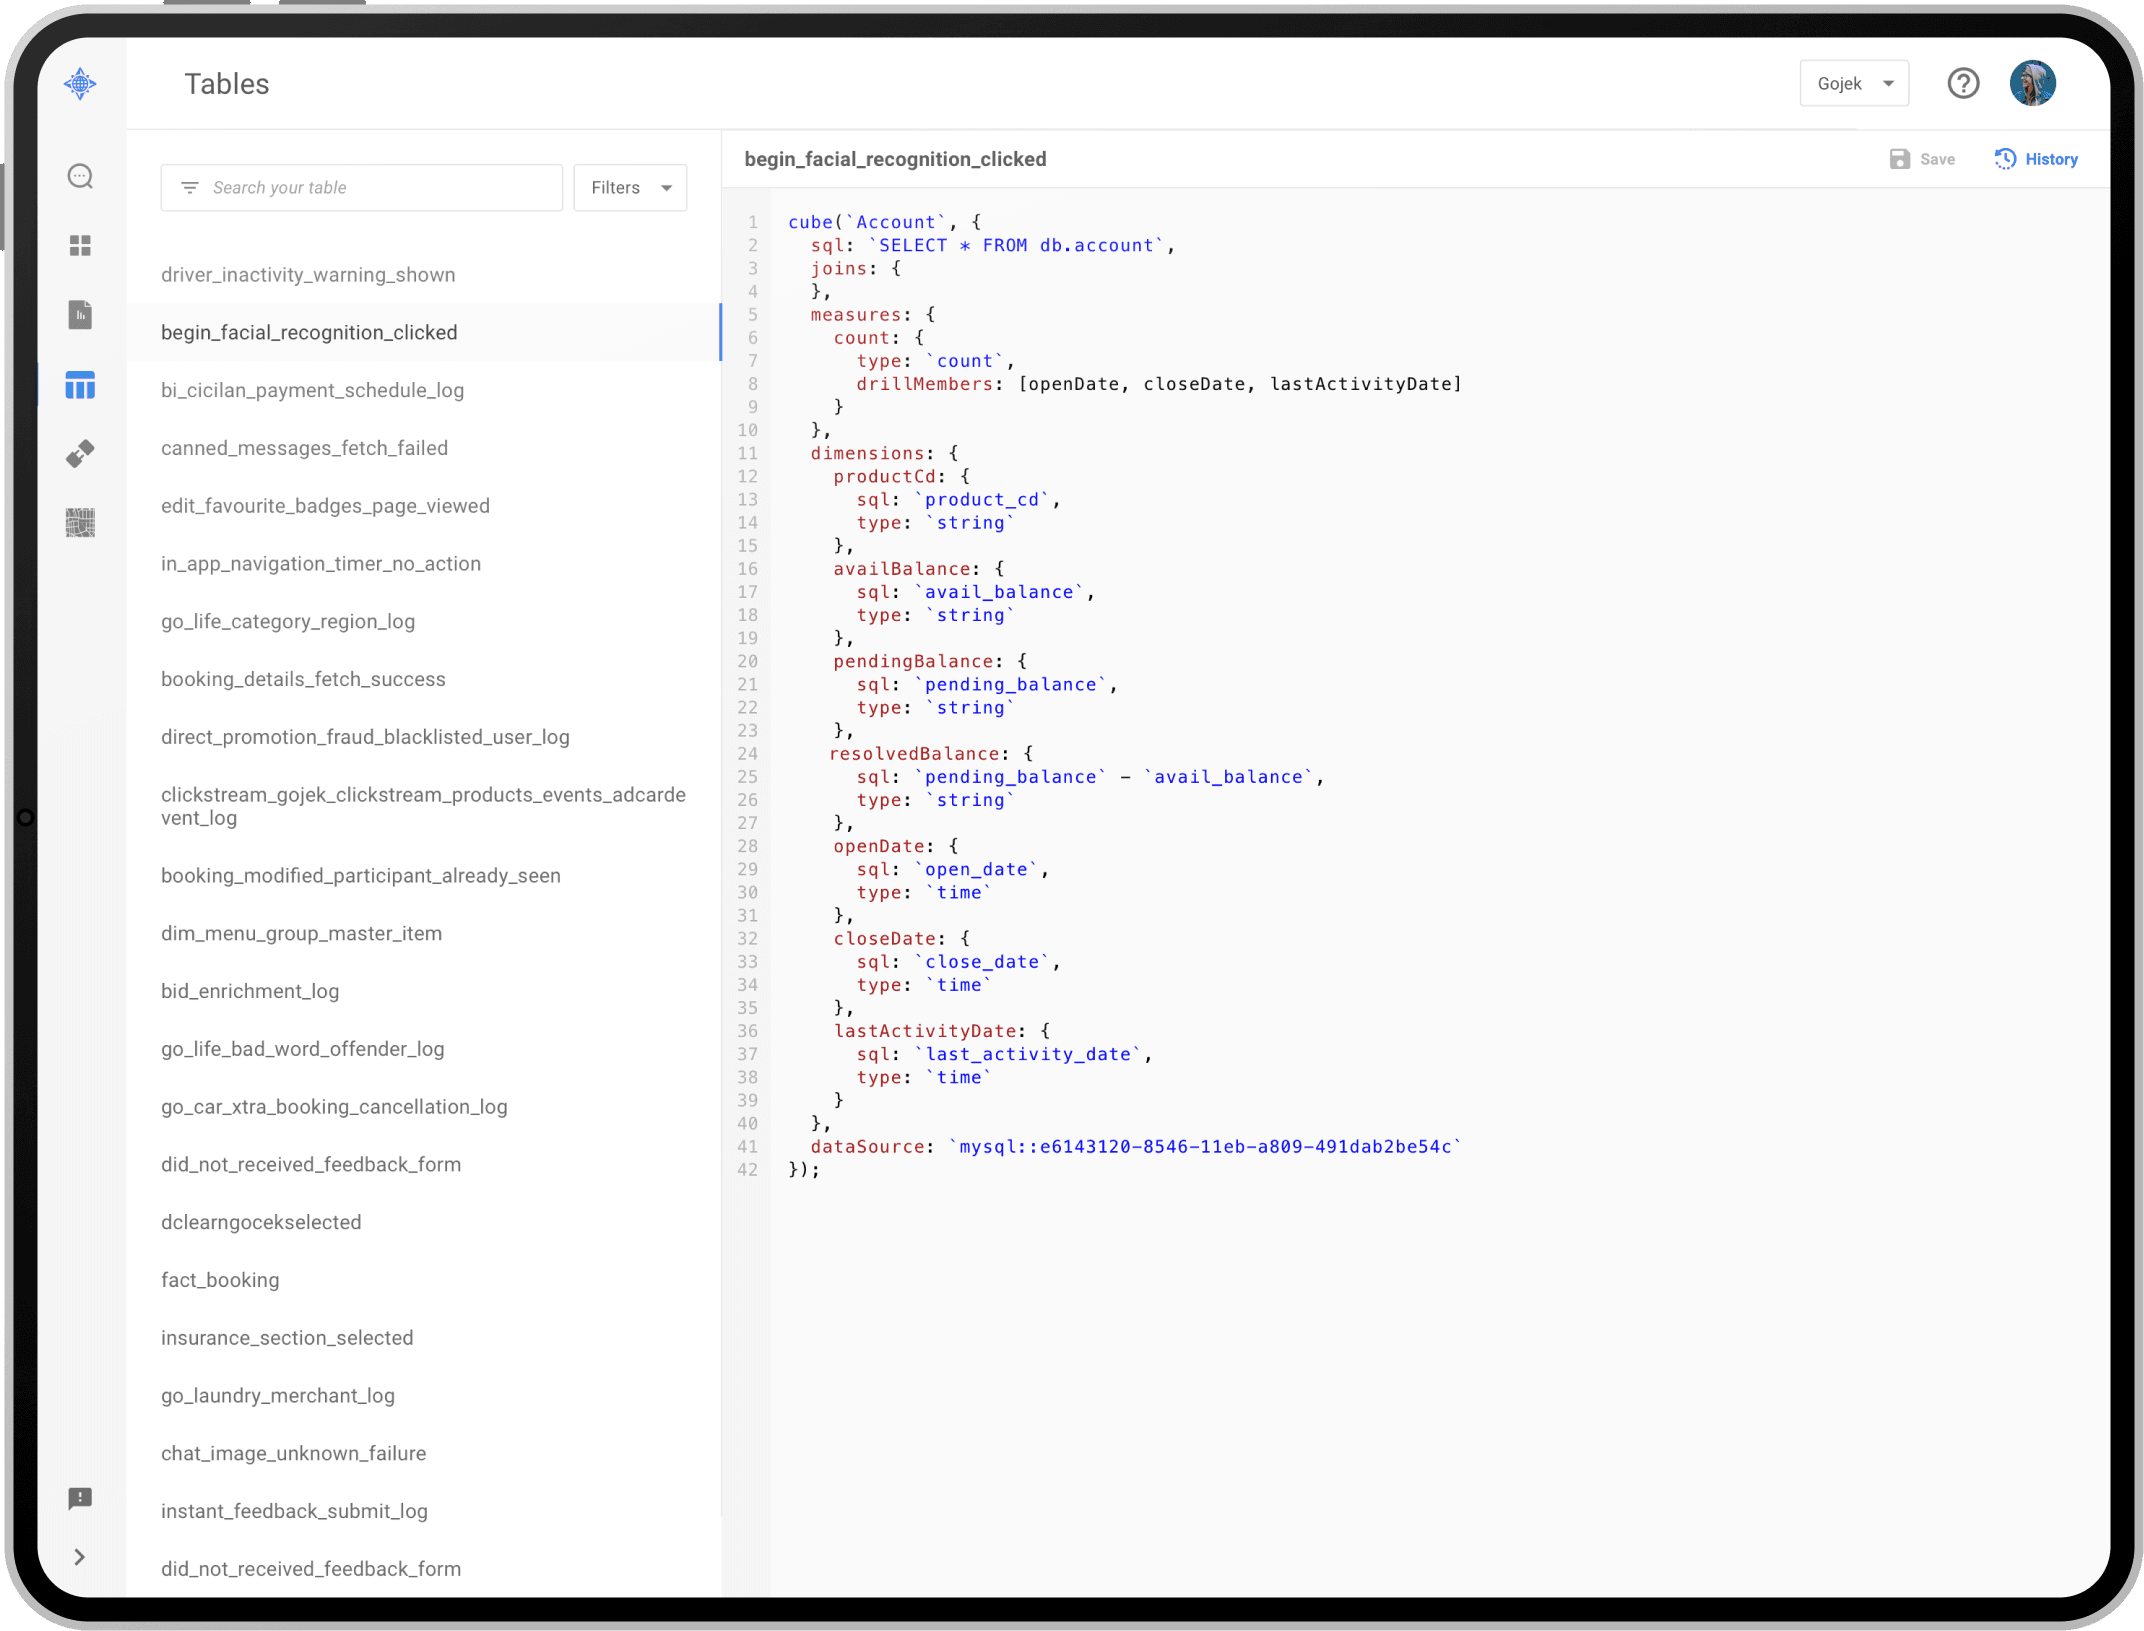
Our system generates a schema from the tables available in data source, this let’s user define quantitative and categorical data. Here users can define filters and dimensions that can be used as exploratory properties.
Our system explicitly provides visibility for all the information needed for someone to trust the data. Users can look into the formulas defined for a metric and how it’s calculated.
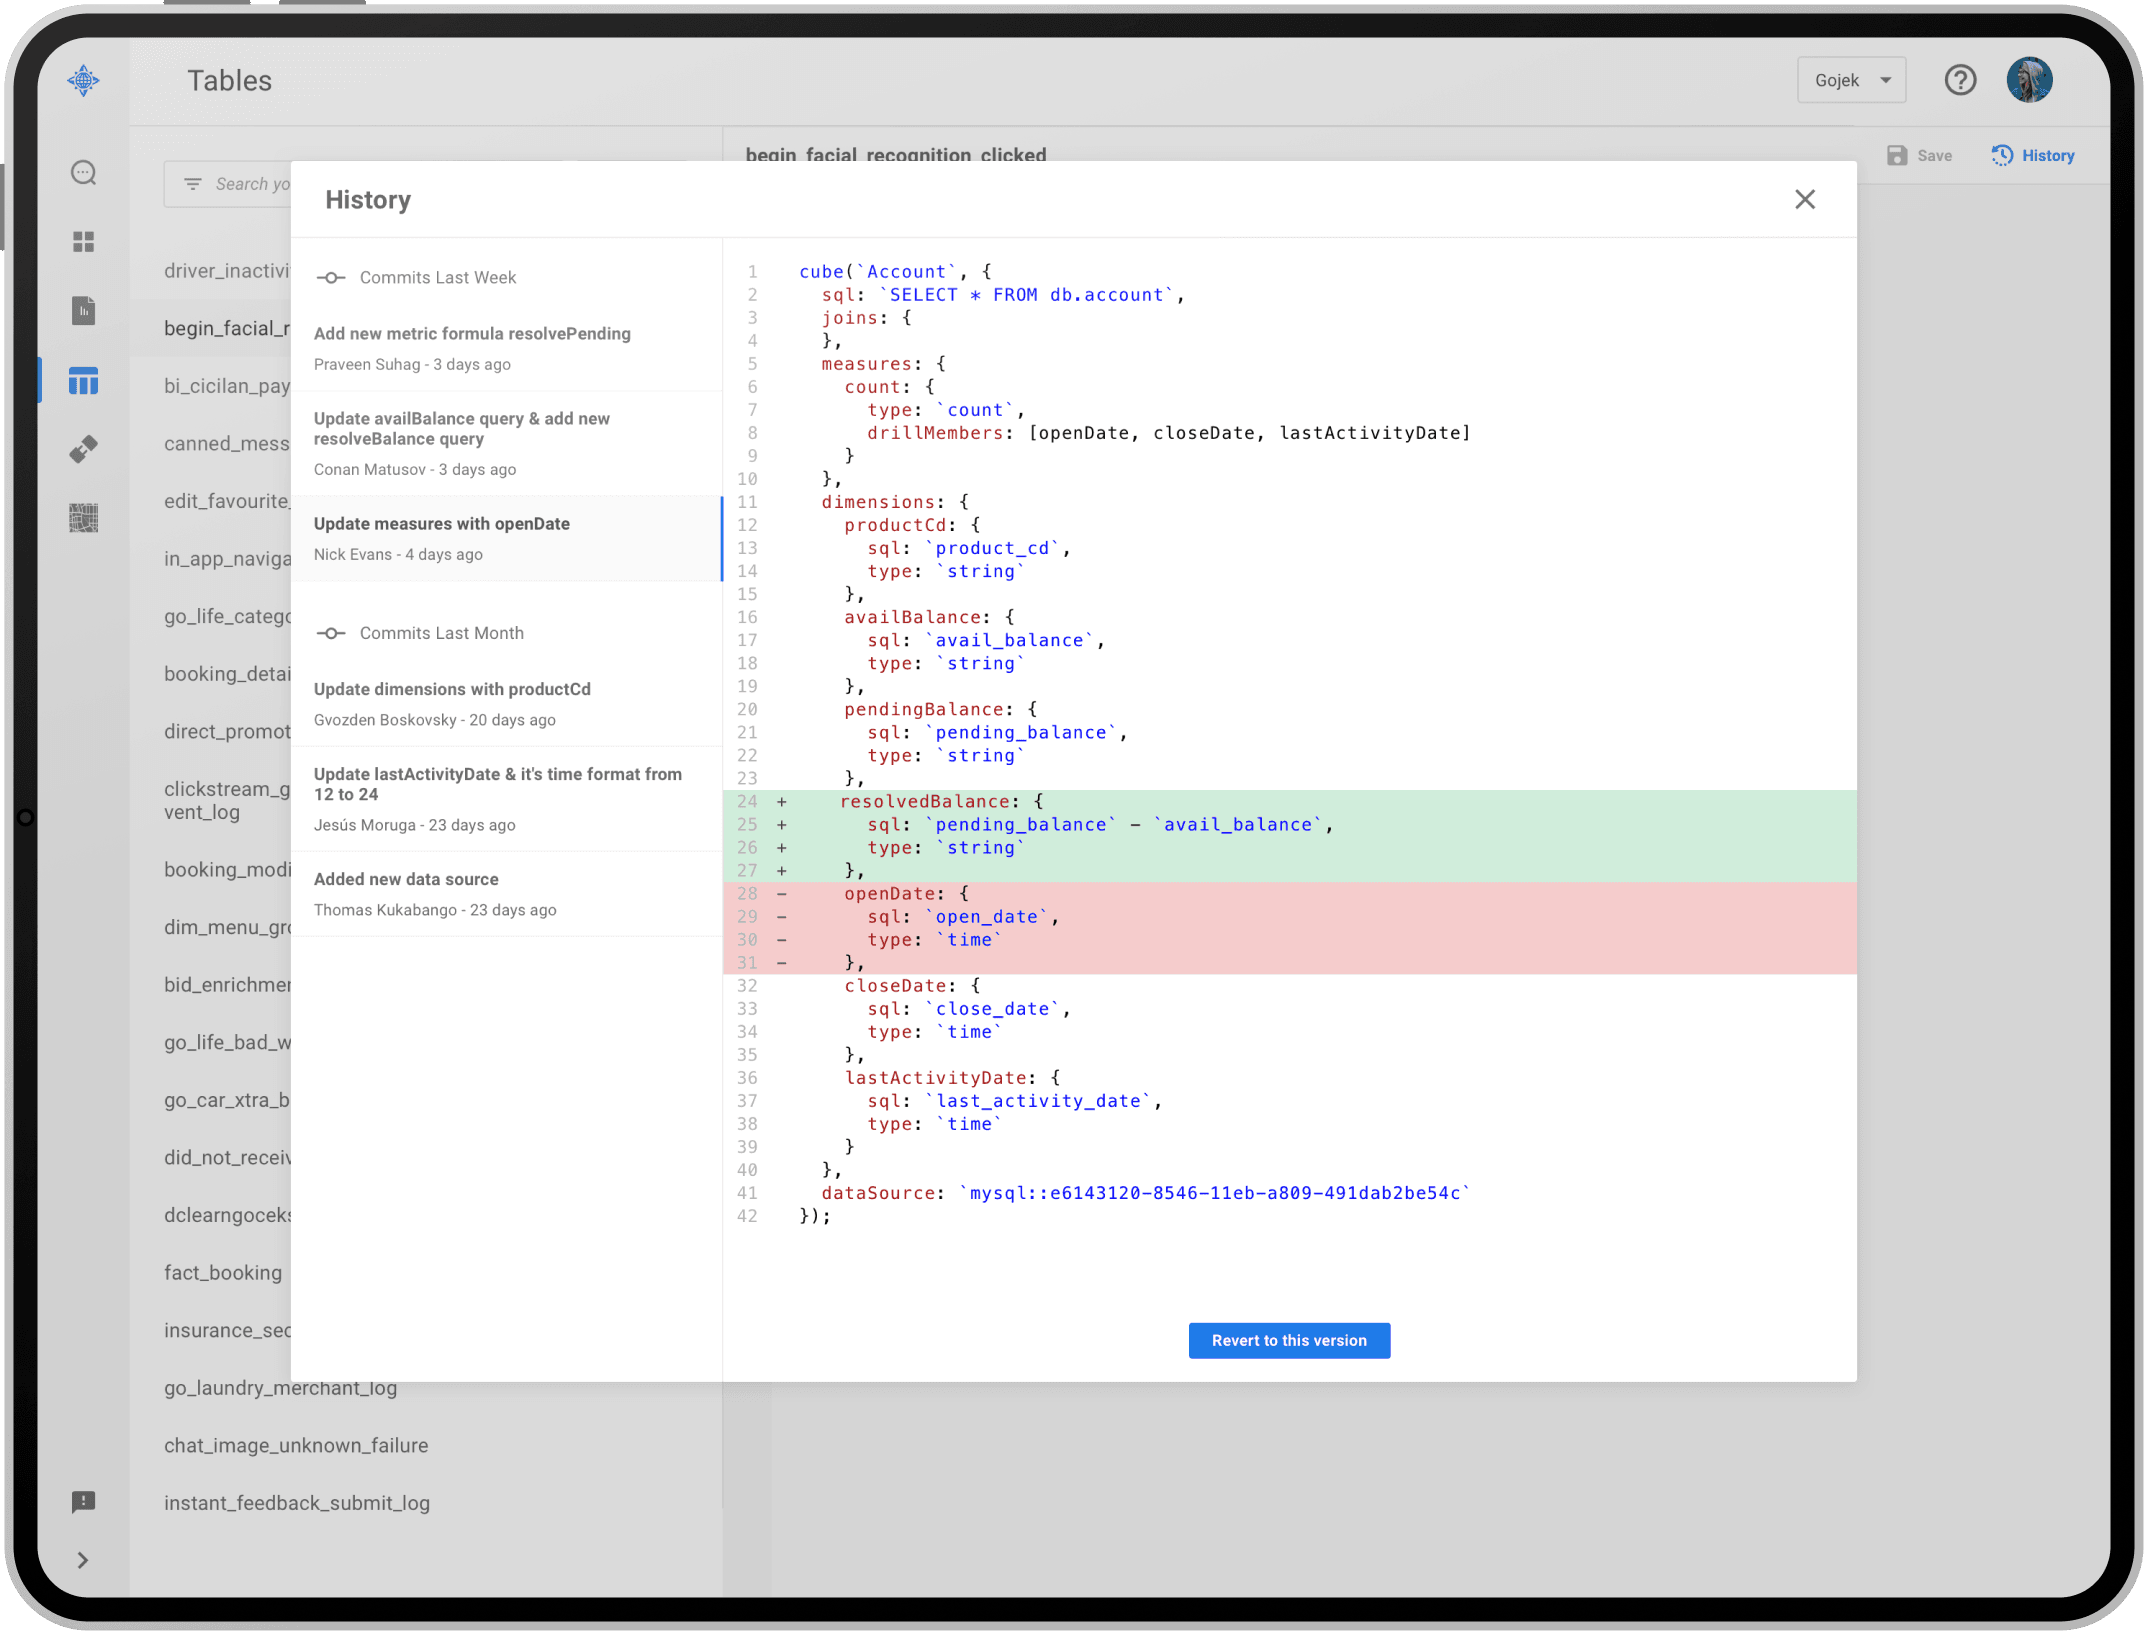
Audit History
The audit feature provides visibility into the evolution of a schema, what are all the changes made in the past and by whom. Allowing this to be managed like code, version control gives complete visibility and helps build the trust in data.

Making it accessible
Once the system is centralized and all the metrics are onboarded on to it, lot of day to day things become simple. Users don’t have to Slack people to ask where metrics are stored. If anyone has any question related to metrics they have one single place to look at and it’s cosmos. No more back and forth communication and requesting access to many google sheets.

Making it actionable
The problem with the existing system was that it created a dependency on analysts to do exploratory analysis. Business owners couldn’t perform such actions without the knowledge of how to query.
Making the data available to everyone, and free up data analysts to work on more crucial projects became very obvious. But we can not expect people to learn analytics skills so that they can navigate through this data.
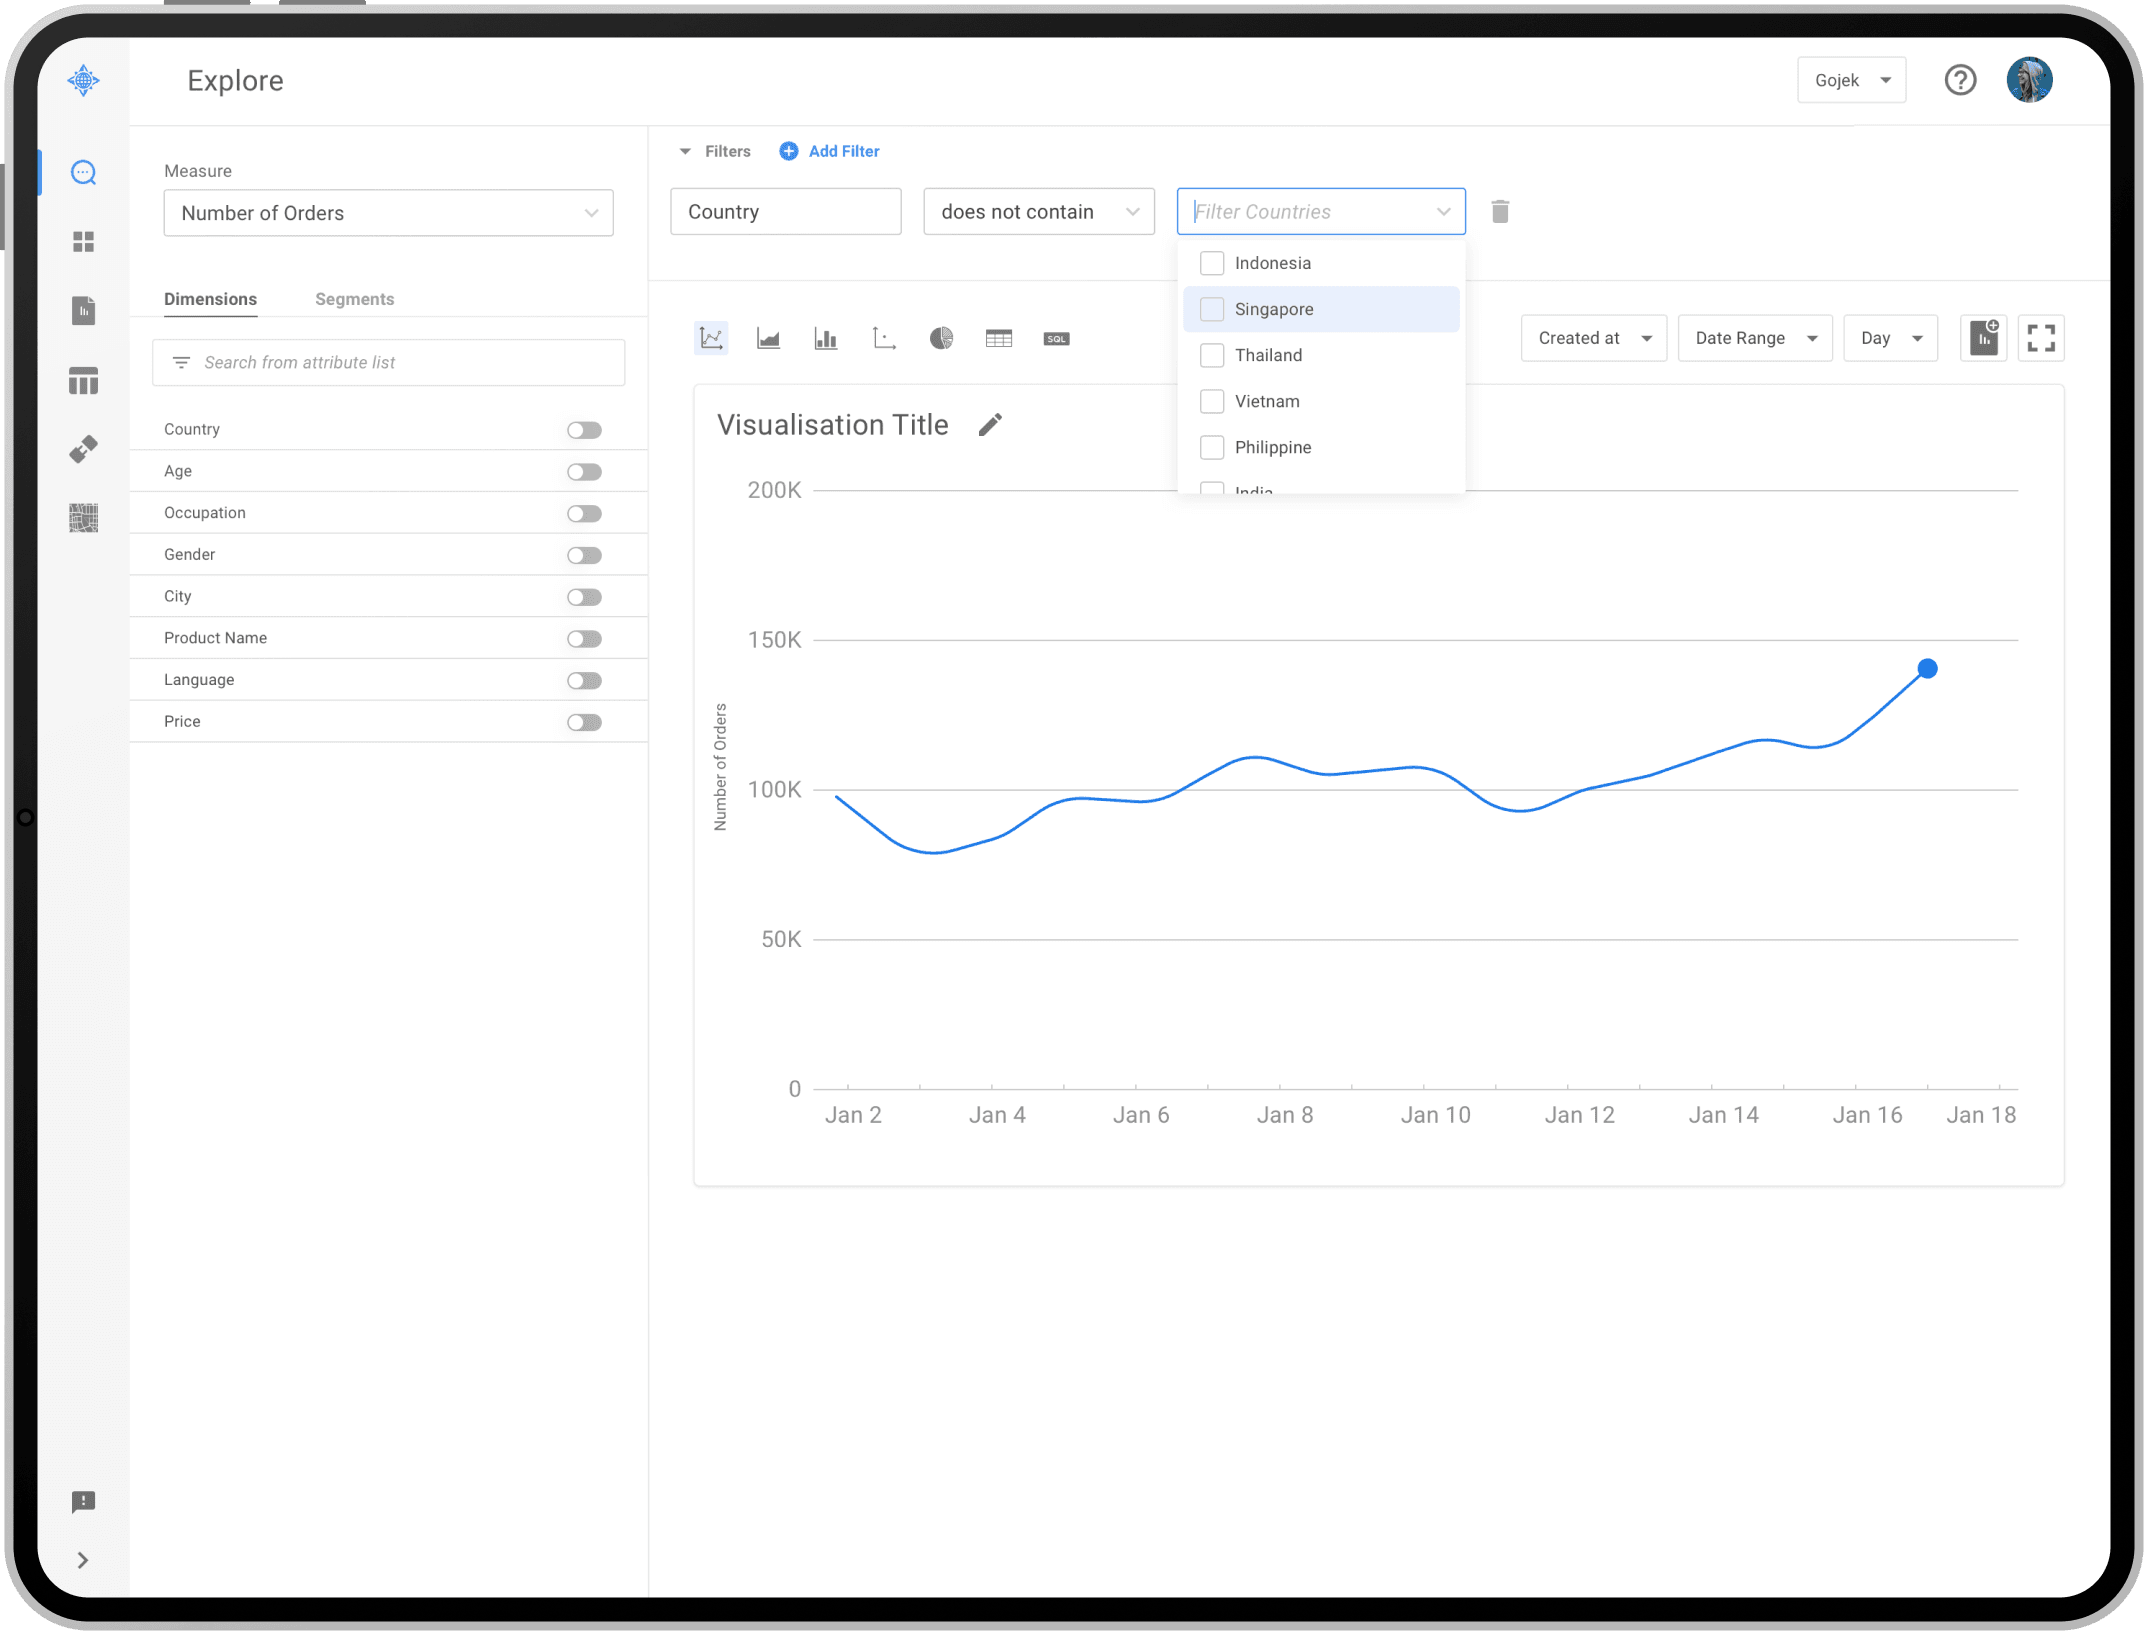
No, it has to be approached in a way that system take away that burden from users shoulder so that they can easily explore the data and get answers to their questions.
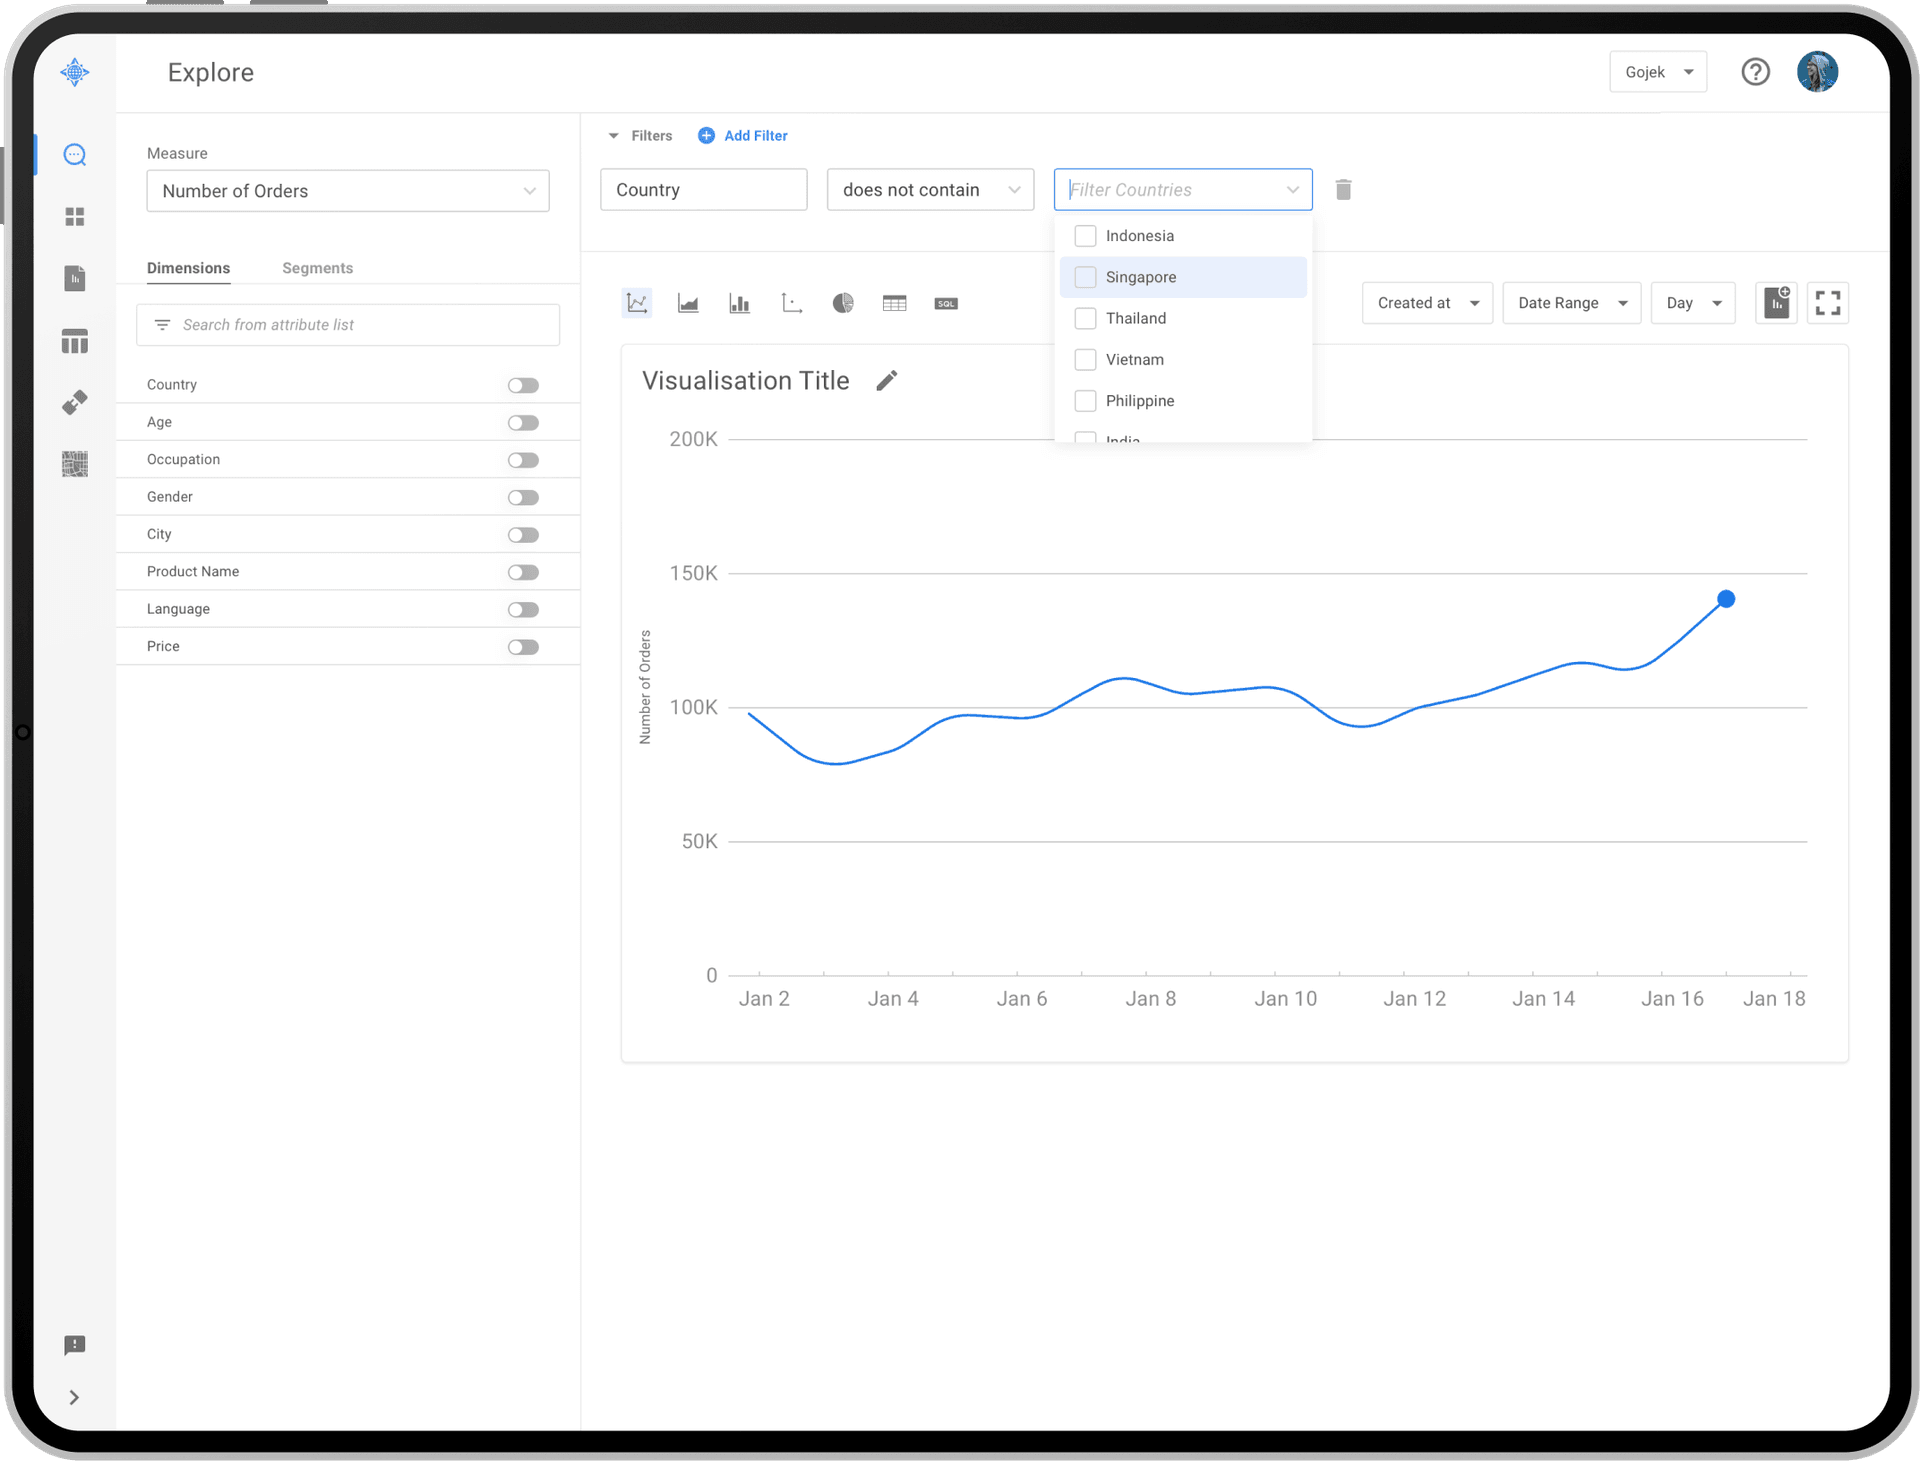
We translated the raw data into simple and expressive experience for them to explore all the meta data or properties by selecting their rules and requirements.

Pixel and code by Praveen Suhag